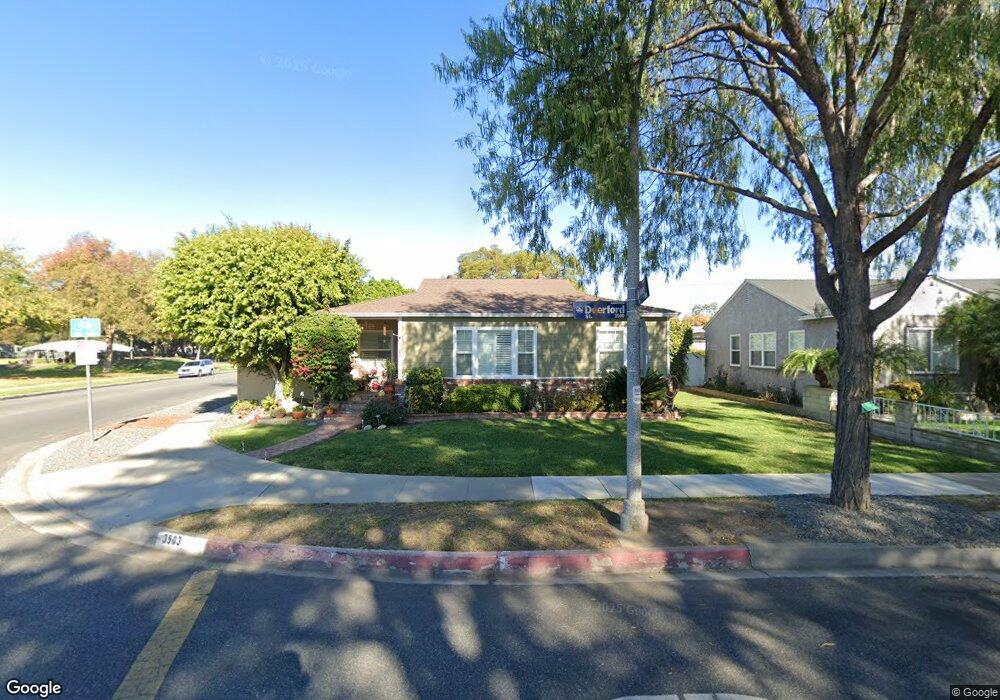
3503 Deerford St Lakewood, CA 90712
Lakewood Mutual NeighborhoodEstimated Value: $773,000 - $977,000
3
Beds
1
Bath
1,299
Sq Ft
$697/Sq Ft
Est. Value
About This Home
This home is located at 3503 Deerford St, Lakewood, CA 90712 and is currently estimated at $904,951, approximately $696 per square foot. 3503 Deerford St is a home located in Los Angeles County with nearby schools including Riley Elementary School, Hoover Middle School, and Lakewood High School.
Ownership History
Date
Name
Owned For
Owner Type
Purchase Details
Closed on
Dec 24, 2001
Sold by
Sandate Richard
Bought by
Padilla Gabriela
Current Estimated Value
Home Financials for this Owner
Home Financials are based on the most recent Mortgage that was taken out on this home.
Original Mortgage
$254,600
Interest Rate
6.39%
Purchase Details
Closed on
Dec 20, 2001
Sold by
Padilla Carlos
Bought by
Padilla Gabriela
Home Financials for this Owner
Home Financials are based on the most recent Mortgage that was taken out on this home.
Original Mortgage
$254,600
Interest Rate
6.39%
Purchase Details
Closed on
Oct 26, 2001
Sold by
Sandate Maureen and Sandate Maureen Ann
Bought by
Padilla Gabriela
Home Financials for this Owner
Home Financials are based on the most recent Mortgage that was taken out on this home.
Original Mortgage
$254,600
Interest Rate
6.39%
Create a Home Valuation Report for This Property
The Home Valuation Report is an in-depth analysis detailing your home's value as well as a comparison with similar homes in the area
Home Values in the Area
Average Home Value in this Area
Purchase History
| Date | Buyer | Sale Price | Title Company |
|---|---|---|---|
| Padilla Gabriela | $134,000 | Fidelity National Title Co | |
| Padilla Gabriela | -- | -- | |
| Padilla Gabriela | $134,000 | Fidelity National Title Co |
Source: Public Records
Mortgage History
| Date | Status | Borrower | Loan Amount |
|---|---|---|---|
| Previous Owner | Padilla Gabriela | $254,600 |
Source: Public Records
Tax History Compared to Growth
Tax History
| Year | Tax Paid | Tax Assessment Tax Assessment Total Assessment is a certain percentage of the fair market value that is determined by local assessors to be the total taxable value of land and additions on the property. | Land | Improvement |
|---|---|---|---|---|
| 2025 | $5,419 | $395,894 | $312,292 | $83,602 |
| 2024 | $5,419 | $388,132 | $306,169 | $81,963 |
| 2023 | $5,329 | $380,522 | $300,166 | $80,356 |
| 2022 | $5,013 | $373,062 | $294,281 | $78,781 |
| 2021 | $4,914 | $365,748 | $288,511 | $77,237 |
| 2019 | $4,843 | $354,902 | $279,954 | $74,948 |
| 2018 | $4,660 | $347,944 | $274,465 | $73,479 |
| 2016 | $4,294 | $334,435 | $263,808 | $70,627 |
| 2015 | $4,129 | $329,413 | $259,846 | $69,567 |
| 2014 | $4,104 | $322,961 | $254,756 | $68,205 |
Source: Public Records
Map
Nearby Homes
- 3638 Sandwood St
- 4944 Coke Ave
- 3244 Centralia St
- 2922 Eckleson St
- 4848 Oliva Ave
- 4559 Levelside Ave
- 2918 Yearling St
- 2912 Yearling St
- 2803 Frankel St
- 4740 Pepperwood Ave
- 2739 Denmead St
- 2729 Greentop St
- 2523 Allred St
- 4121 Country Club Dr
- 4532 Pepperwood Ave
- 4520 Pepperwood Ave
- 4808 Graywood Ave
- 4851 Faculty Ave
- 5450 N Paramount Blvd Unit 12
- 5602 Verdura Ave
- 3507 Deerford St
- 3513 Deerford St
- 3508 Allred St
- 3502 Allred St
- 3514 Allred St
- 3517 Deerford St
- 3504 Deerford St
- 3520 Allred St
- 3512 Deerford St
- 3523 Deerford St
- 3524 Allred St
- 3516 Deerford St
- 4832 Downey Ave
- 3527 Deerford St
- 3522 Deerford St
- 3513 Allred St
- 3503 Loomis St
- 3519 Allred St
- 3528 Deerford St
- 3536 Allred St