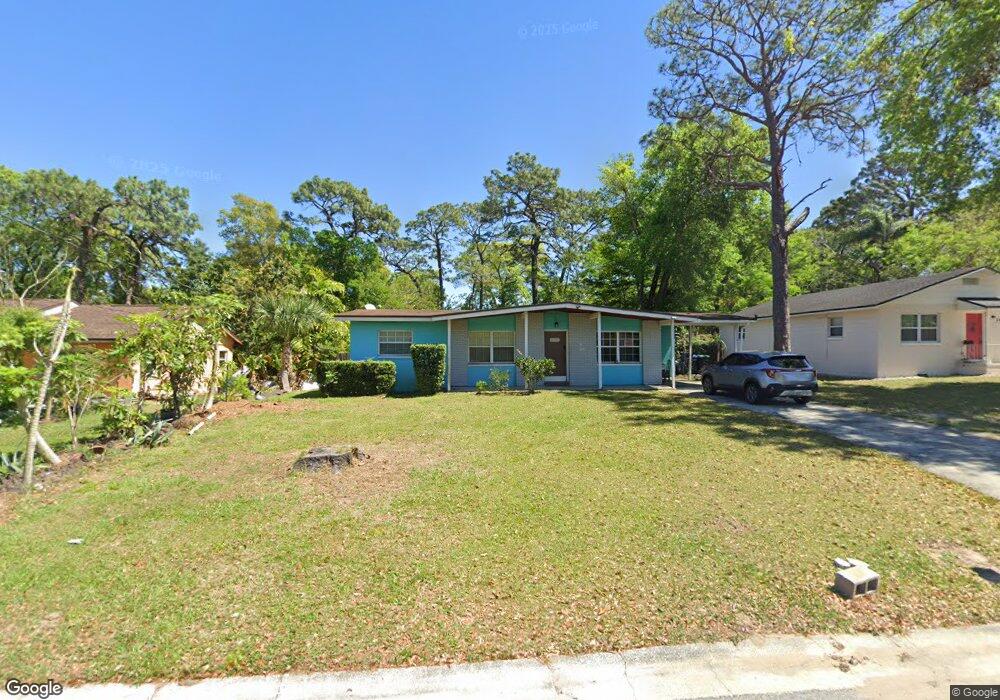
3503 Ridgemont Rd Orlando, FL 32808
Estimated Value: $223,555 - $269,000
3
Beds
2
Baths
1,192
Sq Ft
$211/Sq Ft
Est. Value
About This Home
This home is located at 3503 Ridgemont Rd, Orlando, FL 32808 and is currently estimated at $251,139, approximately $210 per square foot. 3503 Ridgemont Rd is a home located in Orange County with nearby schools including Ridgewood Park Elementary School, Meadowbrook Middle School, and Evans High School.
Ownership History
Date
Name
Owned For
Owner Type
Purchase Details
Closed on
Oct 4, 2019
Sold by
Ardjoensing Thakurdai and Ardjoensing Ronald H
Bought by
Ardjoensing Thakurdai and Thakurdai Ardjoensing Living T
Current Estimated Value
Purchase Details
Closed on
Aug 6, 2010
Sold by
Jernigan Llc
Bought by
Ardjoensing Thakurdai
Purchase Details
Closed on
Jul 27, 2010
Sold by
Wells Fargo Bank Na
Bought by
Jernignan Llc
Purchase Details
Closed on
May 20, 2010
Sold by
Wells Fargo Bank Na
Bought by
Wells Fargo Bank Na
Purchase Details
Closed on
Mar 1, 2010
Sold by
Anderson Naaman and Anderson Mavis A
Bought by
Wells Fargo Bank Na
Purchase Details
Closed on
Jul 10, 2002
Sold by
Irene V Fejes I
Bought by
Anderson Naaman and Anderson Mavis A
Home Financials for this Owner
Home Financials are based on the most recent Mortgage that was taken out on this home.
Original Mortgage
$78,000
Interest Rate
6.75%
Mortgage Type
New Conventional
Create a Home Valuation Report for This Property
The Home Valuation Report is an in-depth analysis detailing your home's value as well as a comparison with similar homes in the area
Home Values in the Area
Average Home Value in this Area
Purchase History
| Date | Buyer | Sale Price | Title Company |
|---|---|---|---|
| Ardjoensing Thakurdai | -- | Attorney | |
| Ardjoensing Thakurdai | $33,000 | Southeast Professional Title | |
| Jernignan Llc | $27,100 | Landsafe Title | |
| Wells Fargo Bank Na | -- | Attorney | |
| Wells Fargo Bank Na | -- | Attorney | |
| Anderson Naaman | $78,000 | -- |
Source: Public Records
Mortgage History
| Date | Status | Borrower | Loan Amount |
|---|---|---|---|
| Previous Owner | Anderson Naaman | $78,000 |
Source: Public Records
Tax History Compared to Growth
Tax History
| Year | Tax Paid | Tax Assessment Tax Assessment Total Assessment is a certain percentage of the fair market value that is determined by local assessors to be the total taxable value of land and additions on the property. | Land | Improvement |
|---|---|---|---|---|
| 2025 | $2,163 | $97,945 | -- | -- |
| 2024 | $1,976 | $97,945 | -- | -- |
| 2023 | $1,976 | $144,926 | $45,000 | $99,926 |
| 2022 | $1,759 | $125,116 | $40,000 | $85,116 |
| 2021 | $1,602 | $107,606 | $32,000 | $75,606 |
| 2020 | $1,502 | $108,996 | $32,000 | $76,996 |
| 2019 | $1,520 | $108,191 | $63,900 | $44,291 |
| 2018 | $1,308 | $82,951 | $20,000 | $62,951 |
| 2017 | $1,077 | $57,235 | $18,000 | $39,235 |
| 2016 | $981 | $49,573 | $10,000 | $39,573 |
| 2015 | $960 | $48,739 | $10,000 | $38,739 |
| 2014 | $894 | $39,022 | $10,000 | $29,022 |
Source: Public Records
Map
Nearby Homes
- 3516 Ridgemont Rd
- 3603 Westwood Rd
- 5911 Fernhill Dr
- 5812 Viking Rd
- 3660 Timber Trail
- 5806 Fernhill Dr
- 5804 Viking Rd
- 5891 Sir Henry Rd
- 6120 Beechmont Blvd
- 3404 Forestdale Dr
- 3217 Castle Oak Ave
- 3641 Mandalay Ct
- 4007 Timber Trail
- 3133 Crooked Oak Ct
- 5511 Indian Hill Rd
- 5702 Meridian Way
- 6015 Denson Dr
- 2900 Woodbridge Ln
- 5601 Meridian Way
- 5614 Riviera Dr
- 3509 Ridgemont Rd
- 3417 Ridgemont Rd
- 3515 Ridgemont Rd
- 3411 Ridgemont Rd
- 5922 Indian Hill Rd
- 3504 Ridgemont Rd
- 3510 Ridgemont Rd
- 3418 Ridgemont Rd
- 3521 Ridgemont Rd
- 3405 Ridgemont Rd
- 3412 Ridgemont Rd
- 3400 Ridgemont Rd
- 3522 Ridgemont Rd
- 3527 Ridgemont Rd
- 3406 Ridgemont Rd
- 3423 Alissa Ct
- 3431 Alissa Ct
- 3415 Alissa Ct
- 3439 Alissa Ct
- 3528 Ridgemont Rd