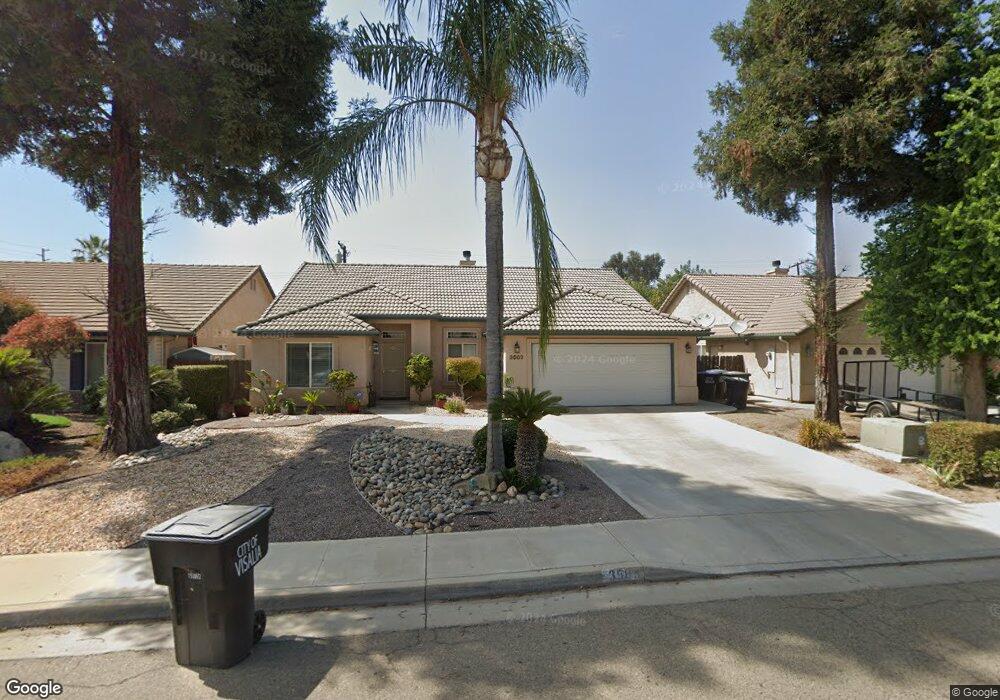
3503 S Martin Ct Visalia, CA 93277
Mooney NeighborhoodEstimated Value: $376,000 - $451,000
4
Beds
3
Baths
1,770
Sq Ft
$228/Sq Ft
Est. Value
About This Home
This home is located at 3503 S Martin Ct, Visalia, CA 93277 and is currently estimated at $402,929, approximately $227 per square foot. 3503 S Martin Ct is a home located in Tulare County with nearby schools including Mountain View Elementary School, Divisadero Middle School, and Mt. Whitney High School.
Ownership History
Date
Name
Owned For
Owner Type
Purchase Details
Closed on
Apr 1, 2020
Sold by
Moore Cassandra Gale
Bought by
Moore Cassandra Gale
Current Estimated Value
Home Financials for this Owner
Home Financials are based on the most recent Mortgage that was taken out on this home.
Original Mortgage
$209,600
Outstanding Balance
$185,680
Interest Rate
3.4%
Mortgage Type
New Conventional
Estimated Equity
$217,249
Purchase Details
Closed on
Jul 25, 2013
Sold by
Hutchinson Darryl
Bought by
Moore Cassandra G
Home Financials for this Owner
Home Financials are based on the most recent Mortgage that was taken out on this home.
Original Mortgage
$186,200
Interest Rate
3.92%
Mortgage Type
New Conventional
Purchase Details
Closed on
May 26, 1999
Sold by
Deochoa Robert
Bought by
Moore Cassandra G
Home Financials for this Owner
Home Financials are based on the most recent Mortgage that was taken out on this home.
Original Mortgage
$123,484
Interest Rate
7.51%
Mortgage Type
FHA
Create a Home Valuation Report for This Property
The Home Valuation Report is an in-depth analysis detailing your home's value as well as a comparison with similar homes in the area
Home Values in the Area
Average Home Value in this Area
Purchase History
| Date | Buyer | Sale Price | Title Company |
|---|---|---|---|
| Moore Cassandra Gale | -- | Chicago Title Company | |
| Moore Cassandra G | -- | Lsi Title Company | |
| Moore Cassandra G | $127,500 | Chicago Title Co |
Source: Public Records
Mortgage History
| Date | Status | Borrower | Loan Amount |
|---|---|---|---|
| Open | Moore Cassandra Gale | $209,600 | |
| Closed | Moore Cassandra G | $186,200 | |
| Previous Owner | Moore Cassandra G | $123,484 |
Source: Public Records
Tax History Compared to Growth
Tax History
| Year | Tax Paid | Tax Assessment Tax Assessment Total Assessment is a certain percentage of the fair market value that is determined by local assessors to be the total taxable value of land and additions on the property. | Land | Improvement |
|---|---|---|---|---|
| 2025 | $2,264 | $195,355 | $53,797 | $141,558 |
| 2024 | $2,264 | $191,526 | $52,743 | $138,783 |
| 2023 | $2,208 | $187,771 | $51,709 | $136,062 |
| 2022 | $2,095 | $184,091 | $50,696 | $133,395 |
| 2021 | $2,073 | $180,481 | $49,702 | $130,779 |
| 2020 | $2,056 | $178,630 | $49,192 | $129,438 |
| 2019 | $1,983 | $175,127 | $48,227 | $126,900 |
| 2018 | $1,916 | $171,693 | $47,281 | $124,412 |
| 2017 | $1,881 | $168,327 | $46,354 | $121,973 |
| 2016 | $1,831 | $165,026 | $45,445 | $119,581 |
| 2015 | $1,766 | $162,547 | $44,762 | $117,785 |
| 2014 | $1,766 | $159,363 | $43,885 | $115,478 |
Source: Public Records
Map
Nearby Homes
- 3439 S Lincoln Ct
- 3409 S Hall St
- 1602 W Dorothea Ave
- 1031 W Hemlock Ave
- 1635-1639 W Cameron Ave
- 0 S Mooney Blvd
- 1700 W La Vida Ave
- 0 W Cameron Unit E1 233502
- 1631 W Monte Vista Ave
- 1449 W Whitendale Ave
- 816 W Loyola Ave
- 811 W Russell Ave
- 1414 W Whitendale Ave
- 2936 S Conyer St
- 134 W Kimball Ave
- 2646 S Fairway Ct
- 605 W Russell Ave
- 530 W Kimball Ave
- 612 W Packwood Ct
- 2923 S Johnson St
- 3449 S Martin Ct
- 3515 S Martin Ct
- 3437 S Martin Ct
- 3525 S Martin Ct
- 3516 S Dollner St
- 3446 S Dollner St
- 3506 S Martin Ct
- 3450 S Martin Ct
- 3528 S Dollner St
- 3518 S Martin Ct
- 3429 S Martin Ct
- 3434 S Dollner St
- 3440 S Martin Ct
- 3533 S Martin Ct
- 3526 S Martin Ct
- 3432 S Martin Ct
- 1516 W Caldwell Ave
- 3421 S Martin Ct
- 3426 S Dollner St
- 3534 S Martin Ct