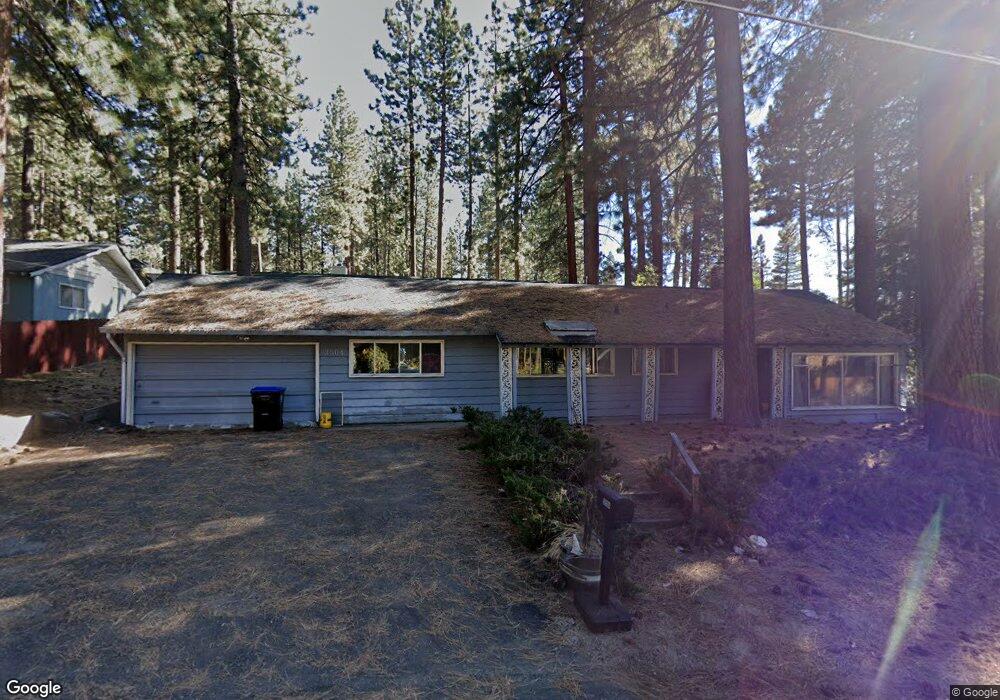
3504 Ferndale Ave South Lake Tahoe, CA 96150
Estimated Value: $545,000 - $593,000
3
Beds
2
Baths
1,527
Sq Ft
$377/Sq Ft
Est. Value
About This Home
This home is located at 3504 Ferndale Ave, South Lake Tahoe, CA 96150 and is currently estimated at $574,983, approximately $376 per square foot. 3504 Ferndale Ave is a home located in El Dorado County with nearby schools including Bijou Community, South Tahoe Middle School, and South Tahoe High School.
Ownership History
Date
Name
Owned For
Owner Type
Purchase Details
Closed on
Jun 16, 2010
Sold by
Garcia Maria S and Garcia Erlinda C
Bought by
Garcia Maria S and Estate Of Joseph A Garcia
Current Estimated Value
Home Financials for this Owner
Home Financials are based on the most recent Mortgage that was taken out on this home.
Original Mortgage
$40,000
Outstanding Balance
$26,570
Interest Rate
4.79%
Mortgage Type
Seller Take Back
Estimated Equity
$548,413
Purchase Details
Closed on
Mar 4, 1998
Sold by
Garcia Joseph S and Garcia Erlinda C
Bought by
Garcia Erlinda C and Garcia Erlinda C
Purchase Details
Closed on
Oct 25, 1995
Sold by
Olen Harry Joseph and Olen Lorraine K
Bought by
Garcia Joseph S and Garcia Erlinda
Home Financials for this Owner
Home Financials are based on the most recent Mortgage that was taken out on this home.
Original Mortgage
$111,200
Outstanding Balance
$779
Interest Rate
7.58%
Estimated Equity
$574,204
Create a Home Valuation Report for This Property
The Home Valuation Report is an in-depth analysis detailing your home's value as well as a comparison with similar homes in the area
Home Values in the Area
Average Home Value in this Area
Purchase History
| Date | Buyer | Sale Price | Title Company |
|---|---|---|---|
| Garcia Maria S | $287,500 | Old Republic Title Company | |
| Garcia Erlinda C | -- | -- | |
| Garcia Joseph S | -- | -- | |
| Garcia Joseph S | $139,000 | Fidelity National Title Ins |
Source: Public Records
Mortgage History
| Date | Status | Borrower | Loan Amount |
|---|---|---|---|
| Open | Garcia Maria S | $40,000 | |
| Open | Garcia Joseph S | $111,200 |
Source: Public Records
Tax History Compared to Growth
Tax History
| Year | Tax Paid | Tax Assessment Tax Assessment Total Assessment is a certain percentage of the fair market value that is determined by local assessors to be the total taxable value of land and additions on the property. | Land | Improvement |
|---|---|---|---|---|
| 2025 | $2,495 | $230,878 | $41,511 | $189,367 |
| 2024 | $2,495 | $226,352 | $40,698 | $185,654 |
| 2023 | $2,452 | $221,914 | $39,900 | $182,014 |
| 2022 | $2,428 | $217,564 | $39,118 | $178,446 |
| 2021 | $2,391 | $213,299 | $38,351 | $174,948 |
| 2020 | $2,357 | $211,113 | $37,958 | $173,155 |
| 2019 | $2,345 | $206,974 | $37,214 | $169,760 |
| 2018 | $2,294 | $202,917 | $36,485 | $166,432 |
| 2017 | $2,258 | $198,939 | $35,770 | $163,169 |
| 2016 | $2,213 | $195,039 | $35,069 | $159,970 |
| 2015 | $2,102 | $192,112 | $34,544 | $157,568 |
| 2014 | $2,102 | $188,351 | $33,868 | $154,483 |
Source: Public Records
Map
Nearby Homes
- 3520 Cloverdale Ave
- 1115 Glenwood Way
- 3508 Fawn Way
- 1151 Herbert Ave Unit B
- 1022 Fairway Ave
- 1094 Johnson Blvd
- 1201 Glenwood Way
- 920 Balbijou Rd Unit 229
- 1160 Bowers Ave
- 3608 Aspen Ave
- 1149 Oak Ave
- 3342 Treehaven Dr
- 3535 Lake Tahoe Blvd Unit 130
- 3535 Lake Tahoe Blvd Unit 231
- 3535 Lake Tahoe Blvd Unit 623
- 3535 Lake Tahoe Blvd Unit 520
- 3535 Lake Tahoe Blvd Unit 506
- 3535 Lake Tahoe Blvd Unit 499
- 3535 Lake Tahoe Blvd Unit 329
- 3535 Lake Tahoe Blvd Unit 313
- 3505 Blackwood Rd
- 3511 Blackwood Rd
- 1089 Fairway Ave
- 3507 Ferndale Ave
- 3515 Ferndale Ave
- 1111 Fairway Ave
- 1098 Fairway Ave Unit A
- 3520 Ferndale Ave
- 1090 Fairway Ave
- 3510 Blackwood Rd
- 1108 Fairway Ave
- 1106 Fairway Ave
- 3519 Ferndale Ave
- 1084 Fairway Ave
- 1079 Fairway Ave
- 3514 Blackwood Rd
- 1117 Fairway Ave
- 3523 Blackwood Rd
- 3518 Blackwood Rd
- 1112 Fairway Ave