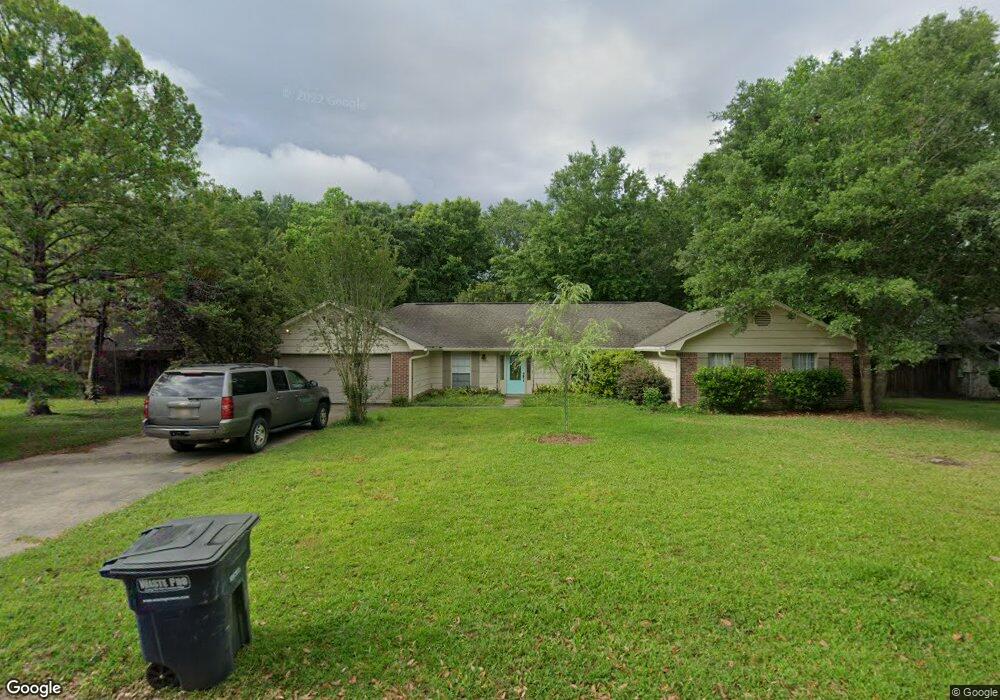
3504 King George St Ocean Springs, MS 39564
Estimated Value: $289,000 - $320,000
4
Beds
2
Baths
2,340
Sq Ft
$131/Sq Ft
Est. Value
About This Home
This home is located at 3504 King George St, Ocean Springs, MS 39564 and is currently estimated at $305,507, approximately $130 per square foot. 3504 King George St is a home located in Jackson County with nearby schools including Oak Park Elementary School, Ocean Springs Middle School, and Ocean Springs High School.
Ownership History
Date
Name
Owned For
Owner Type
Purchase Details
Closed on
Aug 28, 2025
Sold by
Pryor Bonnel F
Bought by
Bonnel And Golda Pryor Revocable Living Trust
Current Estimated Value
Purchase Details
Closed on
May 14, 2025
Sold by
Bonnel And Golda Pryor Revocable Living
Bought by
Pryor Bonnel F
Purchase Details
Closed on
May 27, 2016
Sold by
Travis Amy H and Harris James B
Bought by
Smith Benjamin J and Smith Sara E
Home Financials for this Owner
Home Financials are based on the most recent Mortgage that was taken out on this home.
Original Mortgage
$169,866
Interest Rate
4.25%
Mortgage Type
FHA
Purchase Details
Closed on
Jan 4, 2011
Sold by
Harris D Neil and Harris Michele S
Bought by
Travis James B and Travis Amy H
Home Financials for this Owner
Home Financials are based on the most recent Mortgage that was taken out on this home.
Original Mortgage
$135,000
Interest Rate
4.42%
Create a Home Valuation Report for This Property
The Home Valuation Report is an in-depth analysis detailing your home's value as well as a comparison with similar homes in the area
Home Values in the Area
Average Home Value in this Area
Purchase History
| Date | Buyer | Sale Price | Title Company |
|---|---|---|---|
| Bonnel And Golda Pryor Revocable Living Trust | -- | None Listed On Document | |
| Pryor Bonnel F | -- | None Listed On Document | |
| Smith Benjamin J | -- | Renaissance Title Llc | |
| Travis James B | -- | -- |
Source: Public Records
Mortgage History
| Date | Status | Borrower | Loan Amount |
|---|---|---|---|
| Previous Owner | Smith Benjamin J | $169,866 | |
| Previous Owner | Travis James B | $135,000 |
Source: Public Records
Tax History Compared to Growth
Tax History
| Year | Tax Paid | Tax Assessment Tax Assessment Total Assessment is a certain percentage of the fair market value that is determined by local assessors to be the total taxable value of land and additions on the property. | Land | Improvement |
|---|---|---|---|---|
| 2024 | $974 | $14,257 | $2,041 | $12,216 |
| 2023 | $974 | $14,257 | $2,041 | $12,216 |
| 2022 | $987 | $14,257 | $2,041 | $12,216 |
| 2021 | $1,762 | $14,322 | $2,041 | $12,281 |
| 2020 | $1,525 | $12,548 | $1,855 | $10,693 |
| 2019 | $1,518 | $12,548 | $1,855 | $10,693 |
| 2018 | $1,509 | $12,548 | $1,855 | $10,693 |
| 2017 | $1,509 | $12,548 | $1,855 | $10,693 |
| 2016 | $1,471 | $12,548 | $1,855 | $10,693 |
| 2015 | $1,302 | $111,390 | $18,550 | $92,840 |
| 2014 | $1,368 | $11,682 | $2,056 | $9,626 |
| 2013 | $1,331 | $11,682 | $2,056 | $9,626 |
Source: Public Records
Map
Nearby Homes
- 3407 Parliament Dr
- 1334 Diller Rd
- 3609 Portree Place
- 3230 Cumberland (25) Rd Unit 25
- 3519 Courtenay Cir
- 3230 Cumberland Rd Unit 46
- 3230 Cumberland Rd Unit 10
- 3230 Cumberland Rd Unit 39
- 3230 Cumberland Rd Unit 70
- 3230 Cumberland Rd Unit 81
- 3230 Cumberland Rd Unit 84
- 3230 Cumberland Rd Unit 78
- 3230 Cumberland Rd Unit 89
- 3620 Portree Place
- 1228 Monticello Blvd
- 11424 Memphis Cir
- 104 Everly Cir
- 0 Sanctuary Blvd W Unit 4124102
- 0 Center Dr
- 115 Harper Grove Cir
- 3506 King George St
- 3502 King George St
- 3505 Hastings Ln
- 3508 King George St
- 3507 Hastings Ln
- 3503 Hastings Ln
- 3505 King George St
- 1600 Churchill Dr
- 3503 King George St
- 3507 King George St
- 3509 Hastings Ln
- 3501 King George St
- 3501 Hastings Ln
- 3509 King George St
- 3510 King George St
- 1702 Churchill Dr
- 3511 Hastings Ln
- 3511 King George St
- 1417 Diller Rd
- 1605 Churchill Dr