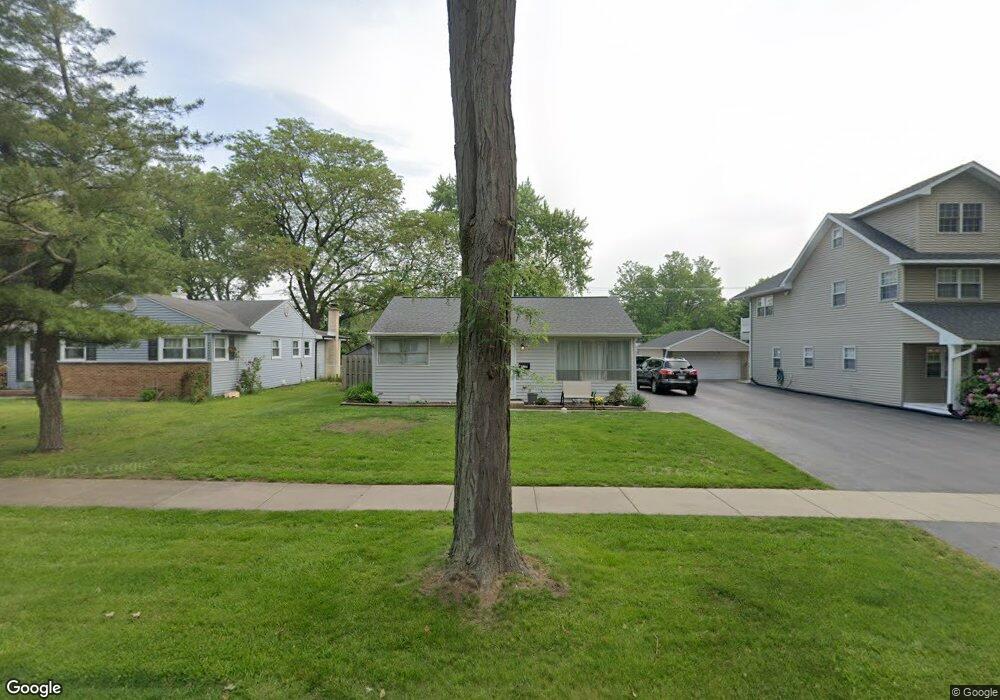
3504 Owl Dr Unit 12 Rolling Meadows, IL 60008
Estimated Value: $276,000 - $346,000
3
Beds
1
Bath
1,199
Sq Ft
$272/Sq Ft
Est. Value
About This Home
This home is located at 3504 Owl Dr Unit 12, Rolling Meadows, IL 60008 and is currently estimated at $325,725, approximately $271 per square foot. 3504 Owl Dr Unit 12 is a home located in Cook County with nearby schools including Central Road Elementary School, Gale School, and King Elementary School.
Ownership History
Date
Name
Owned For
Owner Type
Purchase Details
Closed on
Apr 28, 1998
Sold by
Schutz Charles J and Hartwig Joyce D
Bought by
Sternard John P
Current Estimated Value
Create a Home Valuation Report for This Property
The Home Valuation Report is an in-depth analysis detailing your home's value as well as a comparison with similar homes in the area
Home Values in the Area
Average Home Value in this Area
Purchase History
| Date | Buyer | Sale Price | Title Company |
|---|---|---|---|
| Sternard John P | $118,000 | -- |
Source: Public Records
Tax History Compared to Growth
Tax History
| Year | Tax Paid | Tax Assessment Tax Assessment Total Assessment is a certain percentage of the fair market value that is determined by local assessors to be the total taxable value of land and additions on the property. | Land | Improvement |
|---|---|---|---|---|
| 2024 | $6,340 | $24,000 | $4,950 | $19,050 |
| 2023 | $6,040 | $24,000 | $4,950 | $19,050 |
| 2022 | $6,040 | $24,000 | $4,950 | $19,050 |
| 2021 | $5,496 | $19,926 | $2,925 | $17,001 |
| 2020 | $5,440 | $19,926 | $2,925 | $17,001 |
| 2019 | $5,480 | $22,264 | $2,925 | $19,339 |
| 2018 | $5,213 | $19,529 | $2,700 | $16,829 |
| 2017 | $5,409 | $20,421 | $2,700 | $17,721 |
| 2016 | $5,298 | $20,421 | $2,700 | $17,721 |
| 2015 | $4,788 | $17,831 | $2,475 | $15,356 |
| 2014 | $4,691 | $17,831 | $2,475 | $15,356 |
| 2013 | $4,560 | $17,831 | $2,475 | $15,356 |
Source: Public Records
Map
Nearby Homes
- 3600 Owl Dr
- 4101 Owl Dr
- 3355 Kirchoff Rd Unit 6A
- 3275 Kirchoff Rd Unit 337
- 3265 Kirchoff Rd Unit 223
- 3125 Town Square Dr Unit 408
- 4209 Owl Dr
- 3316 Trillium Cir
- 3400 Wellington Ct Unit 306
- 372 Longacres Ln
- 1 Foxcroft on Auburn
- 3208 Wren Ln
- 2611 South St
- 2503 Fulle St Unit 17
- 208 Brookdale Ln
- 2930 Northampton Dr Unit A2
- 3805 Wren Ln
- 3805 Fairfax Ave
- 2201 Kingfisher Ln
- 2303 Fulle St