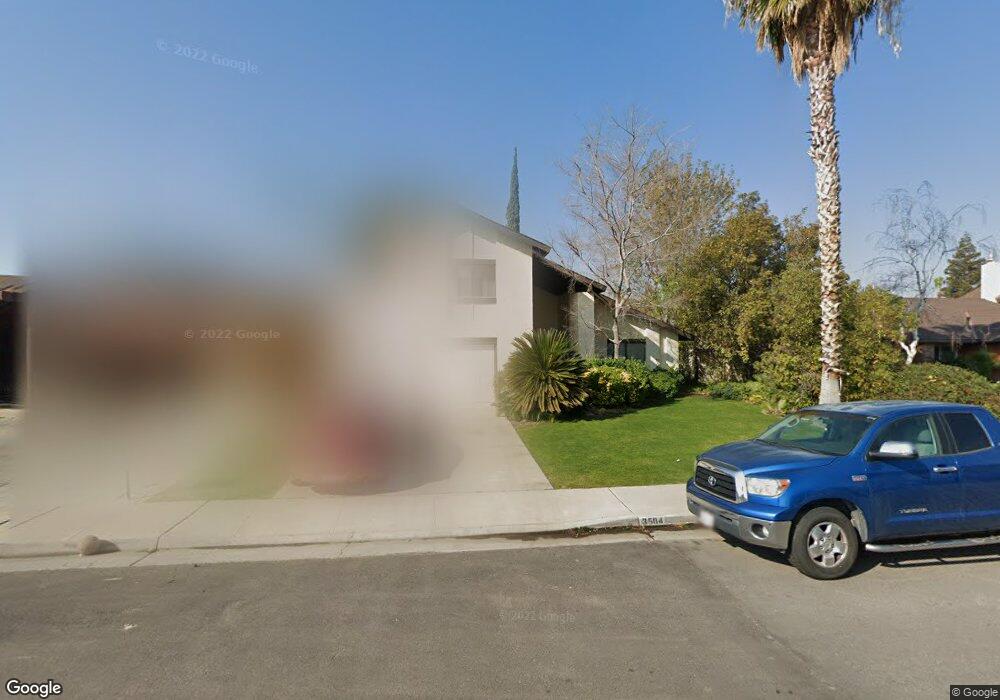
3504 Rancho Sierra St Unit B Bakersfield, CA 93306
College Heights NeighborhoodEstimated Value: $410,189 - $462,000
4
Beds
3
Baths
1,080
Sq Ft
$407/Sq Ft
Est. Value
About This Home
This home is located at 3504 Rancho Sierra St Unit B, Bakersfield, CA 93306 and is currently estimated at $439,297, approximately $406 per square foot. 3504 Rancho Sierra St Unit B is a home located in Kern County with nearby schools including Dr. Juliet Thorner Elementary School, Chipman Junior High School, and Highland High School.
Ownership History
Date
Name
Owned For
Owner Type
Purchase Details
Closed on
Aug 4, 2021
Sold by
Thompson Michael R and The Thompson Family Trust
Bought by
Emerson Michael Edward and Emerson Lezli Thompson
Current Estimated Value
Purchase Details
Closed on
Feb 13, 2003
Sold by
Christian Sonya and Khe Sriram
Bought by
Thompson Michael R and Thompson Raquel K
Home Financials for this Owner
Home Financials are based on the most recent Mortgage that was taken out on this home.
Original Mortgage
$116,250
Outstanding Balance
$49,351
Interest Rate
5.83%
Mortgage Type
Stand Alone First
Estimated Equity
$389,946
Purchase Details
Closed on
Sep 7, 1994
Sold by
Evans Michael L and Evans Ramona
Bought by
Sriram Krishnamurthy and Christian Sonya
Home Financials for this Owner
Home Financials are based on the most recent Mortgage that was taken out on this home.
Original Mortgage
$124,847
Interest Rate
8.58%
Mortgage Type
FHA
Create a Home Valuation Report for This Property
The Home Valuation Report is an in-depth analysis detailing your home's value as well as a comparison with similar homes in the area
Home Values in the Area
Average Home Value in this Area
Purchase History
| Date | Buyer | Sale Price | Title Company |
|---|---|---|---|
| Emerson Michael Edward | -- | Accommodation | |
| Thompson Michael R | $155,000 | First American Title | |
| Sriram Krishnamurthy | $126,000 | First American Title Ins Co |
Source: Public Records
Mortgage History
| Date | Status | Borrower | Loan Amount |
|---|---|---|---|
| Open | Thompson Michael R | $116,250 | |
| Previous Owner | Sriram Krishnamurthy | $124,847 |
Source: Public Records
Tax History Compared to Growth
Tax History
| Year | Tax Paid | Tax Assessment Tax Assessment Total Assessment is a certain percentage of the fair market value that is determined by local assessors to be the total taxable value of land and additions on the property. | Land | Improvement |
|---|---|---|---|---|
| 2025 | $5,004 | $372,483 | $63,672 | $308,811 |
| 2024 | $4,906 | $365,180 | $62,424 | $302,756 |
| 2023 | $4,906 | $358,020 | $61,200 | $296,820 |
| 2022 | $3,157 | $211,526 | $54,582 | $156,944 |
| 2021 | $3,041 | $207,379 | $53,512 | $153,867 |
| 2020 | $3,041 | $205,254 | $52,964 | $152,290 |
| 2019 | $2,944 | $205,254 | $52,964 | $152,290 |
| 2018 | $2,876 | $197,285 | $50,908 | $146,377 |
| 2017 | $2,861 | $193,417 | $49,910 | $143,507 |
| 2016 | $2,616 | $189,626 | $48,932 | $140,694 |
| 2015 | $2,412 | $170,000 | $43,000 | $127,000 |
| 2014 | $2,372 | $170,000 | $43,000 | $127,000 |
Source: Public Records
Map
Nearby Homes
- 3400 Cedar Canyon St Unit A
- 3416 Glenridge St Unit A
- 5717 Fairfax Rd
- 5801 Fairfax Rd
- 5703 Fairfax Rd
- 5816 Hidden Valley Rd
- 5201 Pla Vada Dr
- 5801 Willow Grove Ct
- 5108 Charger Ave
- 5912 Cedar Falls Dr
- 5801 Cedar Falls Dr
- 5912 Cliffwood Way
- 5909 Cliffwood Way
- 3205 Petite Sirah St
- 6305 Wolfe Creek Dr
- 4908 Panorama Dr
- 6213 Castle Cary Dr
- 5928 Dyce Way
- 4808 Panorama Dr
- 4815 Panorama Dr
- 3508 Rancho Sierra St
- 3500 Rancho Sierra St
- 3505 Cedar Canyon St
- 3512 Rancho Sierra St
- 3430 Rancho Sierra St
- 3509 Cedar Canyon St
- 3501 Cedar Canyon St
- 3505 Rancho Sierra St
- 3501 Rancho Sierra St Unit B
- 3513 Cedar Canyon St
- 3429 Cedar Canyon St Unit A
- 3516 Rancho Sierra St
- 3428 Rancho Sierra St
- 3509 Rancho Sierra St Unit B
- 3431 Rancho Sierra St
- 3517 Cedar Canyon St
- 3425 Cedar Canyon St
- 3429 Rancho Sierra St
- 3513 Rancho Sierra St
- 3600 Rancho Sierra St