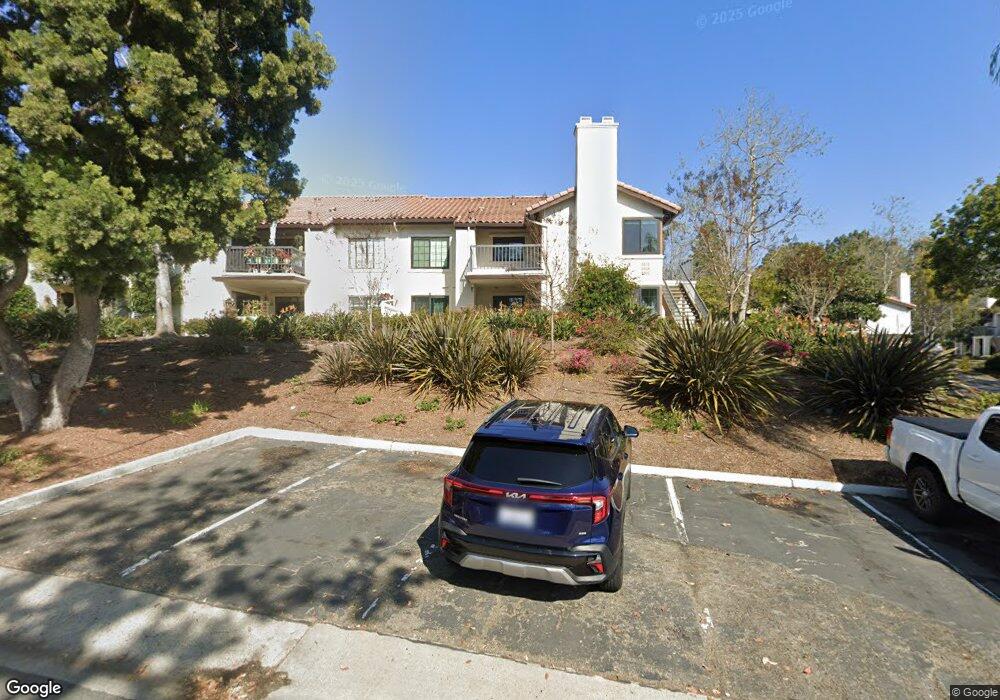
3504 Seahorn Cir San Diego, CA 92130
Carmel Valley NeighborhoodEstimated Value: $879,000 - $936,000
2
Beds
2
Baths
1,097
Sq Ft
$825/Sq Ft
Est. Value
About This Home
This home is located at 3504 Seahorn Cir, San Diego, CA 92130 and is currently estimated at $904,659, approximately $824 per square foot. 3504 Seahorn Cir is a home located in San Diego County with nearby schools including Solana Highlands Elementary School, Carmel Valley Middle School, and Torrey Pines High School.
Ownership History
Date
Name
Owned For
Owner Type
Purchase Details
Closed on
Oct 23, 2017
Sold by
Traft Brent and Traft Arlie V
Bought by
Mu Xinmeng
Current Estimated Value
Home Financials for this Owner
Home Financials are based on the most recent Mortgage that was taken out on this home.
Original Mortgage
$440,000
Outstanding Balance
$367,622
Interest Rate
3.83%
Mortgage Type
New Conventional
Estimated Equity
$537,037
Purchase Details
Closed on
Feb 4, 2004
Sold by
Traft Brent
Bought by
Traft Brent and Traft Wilbur F
Purchase Details
Closed on
Dec 2, 1996
Sold by
Manssour Moussavian A
Bought by
Traft Brent
Home Financials for this Owner
Home Financials are based on the most recent Mortgage that was taken out on this home.
Original Mortgage
$115,500
Interest Rate
7.46%
Mortgage Type
Purchase Money Mortgage
Purchase Details
Closed on
Jul 31, 1996
Sold by
Patrick Rice C
Bought by
Moussavian A Manssour
Purchase Details
Closed on
Apr 27, 1990
Purchase Details
Closed on
Nov 25, 1985
Create a Home Valuation Report for This Property
The Home Valuation Report is an in-depth analysis detailing your home's value as well as a comparison with similar homes in the area
Home Values in the Area
Average Home Value in this Area
Purchase History
| Date | Buyer | Sale Price | Title Company |
|---|---|---|---|
| Mu Xinmeng | $550,000 | Fidelity National Title | |
| Traft Brent | -- | -- | |
| Traft Brent | $144,500 | Chicago Title Company | |
| Moussavian A Manssour | $121,500 | -- | |
| -- | $206,000 | -- | |
| -- | $117,800 | -- |
Source: Public Records
Mortgage History
| Date | Status | Borrower | Loan Amount |
|---|---|---|---|
| Open | Mu Xinmeng | $440,000 | |
| Previous Owner | Traft Brent | $115,500 |
Source: Public Records
Tax History Compared to Growth
Tax History
| Year | Tax Paid | Tax Assessment Tax Assessment Total Assessment is a certain percentage of the fair market value that is determined by local assessors to be the total taxable value of land and additions on the property. | Land | Improvement |
|---|---|---|---|---|
| 2025 | $6,561 | $625,798 | $268,191 | $357,607 |
| 2024 | $6,561 | $613,529 | $262,933 | $350,596 |
| 2023 | $6,415 | $601,500 | $257,778 | $343,722 |
| 2022 | $6,308 | $589,707 | $252,724 | $336,983 |
| 2021 | $6,197 | $578,145 | $247,769 | $330,376 |
| 2020 | $6,143 | $572,218 | $245,229 | $326,989 |
| 2019 | $6,024 | $560,999 | $240,421 | $320,578 |
| 2018 | $5,909 | $550,000 | $235,707 | $314,293 |
| 2017 | $2,186 | $202,621 | $86,835 | $115,786 |
| 2016 | $2,056 | $198,649 | $85,133 | $113,516 |
| 2015 | $2,025 | $195,666 | $83,855 | $111,811 |
| 2014 | $1,984 | $191,834 | $82,213 | $109,621 |
Source: Public Records
Map
Nearby Homes
- 3539 Voyager Cir Unit 15
- 13074 Maritime Place Unit 1
- 3510 Voyager Cir Unit 67
- 3606 Bernwood Place Unit 14
- 13413 Landfair Rd
- 13398 Tiverton Rd
- 14058 Mira Montana Dr
- 3857 Pell Place Unit 406
- 3856 Quarter Mile Dr
- 13754 Mango Dr Unit 111
- 13754 Mango Dr Unit 316
- 3872 Creststone Place
- 3877 Pell Place Unit 424
- 3877 Pell Place Unit 225
- 3550 Caminito el Rincon Unit 69
- 2490 Pinewood St
- 12585 Ruette Alliante Unit 152
- 2476 Pinewood St
- 3537 Caminito el Rincon Unit 259
- 3936 Ambervale Terrace
- 3518 Seahorn Cir
- 3502 Seahorn Cir
- 3506 Seahorn Cir
- 3520 Seahorn Cir
- 3508 Seahorn Cir Unit 58
- 3546 Seahorn Cir
- 3540 Seahorn Cir
- 3538 Seahorn Cir
- 3512 Seahorn Cir Unit 55
- 3510 Seahorn Cir
- 3576 Seahorn Cir
- 3586 Seahorn Cir
- 3574 Seahorn Cir
- 3522 Seahorn Cir
- 3558 Seahorn Cir
- 3552 Seahorn Cir
- 3550 Seahorn Cir
- 3548 Seahorn Cir
- 3544 Seahorn Cir
- 3542 Seahorn Cir