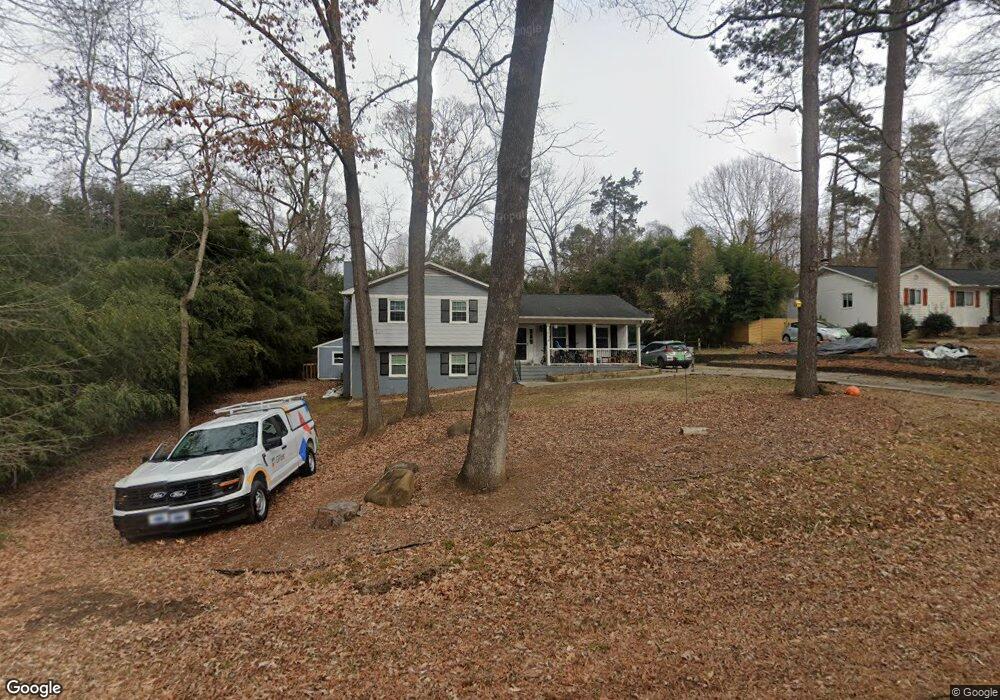
3504 Winding Way Durham, NC 27707
South Square NeighborhoodEstimated Value: $519,000 - $591,000
4
Beds
3
Baths
2,042
Sq Ft
$272/Sq Ft
Est. Value
About This Home
This home is located at 3504 Winding Way, Durham, NC 27707 and is currently estimated at $556,107, approximately $272 per square foot. 3504 Winding Way is a home located in Durham County with nearby schools including Morehead Montessori, Sherwood Githens Middle, and Jordan High School.
Ownership History
Date
Name
Owned For
Owner Type
Purchase Details
Closed on
Nov 4, 2020
Sold by
Berry Mary Janeen and De Alejo Carlos
Bought by
Barrick Trevor Daniel and Bernstein Elyse Lauren
Current Estimated Value
Home Financials for this Owner
Home Financials are based on the most recent Mortgage that was taken out on this home.
Original Mortgage
$308,000
Outstanding Balance
$274,568
Interest Rate
2.9%
Mortgage Type
New Conventional
Estimated Equity
$281,539
Purchase Details
Closed on
Oct 15, 2018
Sold by
Bass Hilda and Bass Steven
Bought by
Berry Dr Maya Janeen and Alejo Carlos Daniel Perez De
Home Financials for this Owner
Home Financials are based on the most recent Mortgage that was taken out on this home.
Original Mortgage
$295,015
Interest Rate
4.6%
Mortgage Type
New Conventional
Purchase Details
Closed on
Mar 8, 2018
Sold by
Storey James R and Storey Sheila F
Bought by
Recycling And Salvage Services Inc
Create a Home Valuation Report for This Property
The Home Valuation Report is an in-depth analysis detailing your home's value as well as a comparison with similar homes in the area
Home Values in the Area
Average Home Value in this Area
Purchase History
We collect this data history from publicly available records. To have your information removed, we recommend requesting removal directly through your county’s website.
| Date | Buyer | Sale Price | Title Company |
|---|---|---|---|
| Barrick Trevor Daniel | $385,000 | None Available | |
| Berry Dr Maya Janeen | $331,000 | None Available | |
| Recycling And Salvage Services Inc | $132,000 | None Available |
Source: Public Records
Mortgage History
We collect this data history from publicly available records. To have your information removed, we recommend requesting removal directly through your county’s website.
| Date | Status | Borrower | Loan Amount |
|---|---|---|---|
| Open | Barrick Trevor Daniel | $308,000 | |
| Previous Owner | Berry Dr Maya Janeen | $295,015 |
Source: Public Records
Tax History
| Year | Tax Paid | Tax Assessment Tax Assessment Total Assessment is a certain percentage of the fair market value that is determined by local assessors to be the total taxable value of land and additions on the property. | Land | Improvement |
|---|---|---|---|---|
| 2025 | $5,049 | $509,358 | $203,500 | $305,858 |
| 2024 | $3,872 | $277,552 | $62,815 | $214,737 |
| 2023 | $3,636 | $277,552 | $62,815 | $214,737 |
| 2022 | $3,552 | $277,552 | $62,815 | $214,737 |
| 2021 | $3,536 | $277,552 | $62,815 | $214,737 |
| 2020 | $3,452 | $277,552 | $62,815 | $214,737 |
| 2019 | $3,452 | $277,552 | $62,815 | $214,737 |
| 2018 | $2,682 | $197,729 | $48,035 | $149,694 |
| 2017 | $2,662 | $197,729 | $48,035 | $149,694 |
| 2016 | $2,573 | $197,729 | $48,035 | $149,694 |
| 2015 | $2,549 | $184,113 | $45,145 | $138,968 |
| 2014 | $2,549 | $184,113 | $45,145 | $138,968 |
Source: Public Records
Map
Nearby Homes
- 203 Valleyshire Rd
- 108 Tressel Way
- 4168 Deep Wood Cir
- 3 Old Hope Creek Path
- 3934 Old Chapel Hill Rd
- 3719 Old Chapel Hill Rd
- 3932 Old Chapel Hill Rd
- 1018 Northampton Rd
- 22 Knightsbridge Ct
- 42 Cheswick Place
- 3437 Dover Rd
- 3606 Old Chapel Hill Rd
- 10 Innisfree Dr
- 3812 Somerset Dr
- 1 Roswell Ct
- 3608 Suffolk St
- 44 Melstone Turn
- 10 Melstone Turn
- 18 Scottish Ln
- 3613 A Suffolk St
Your Personal Tour Guide
Ask me questions while you tour the home.