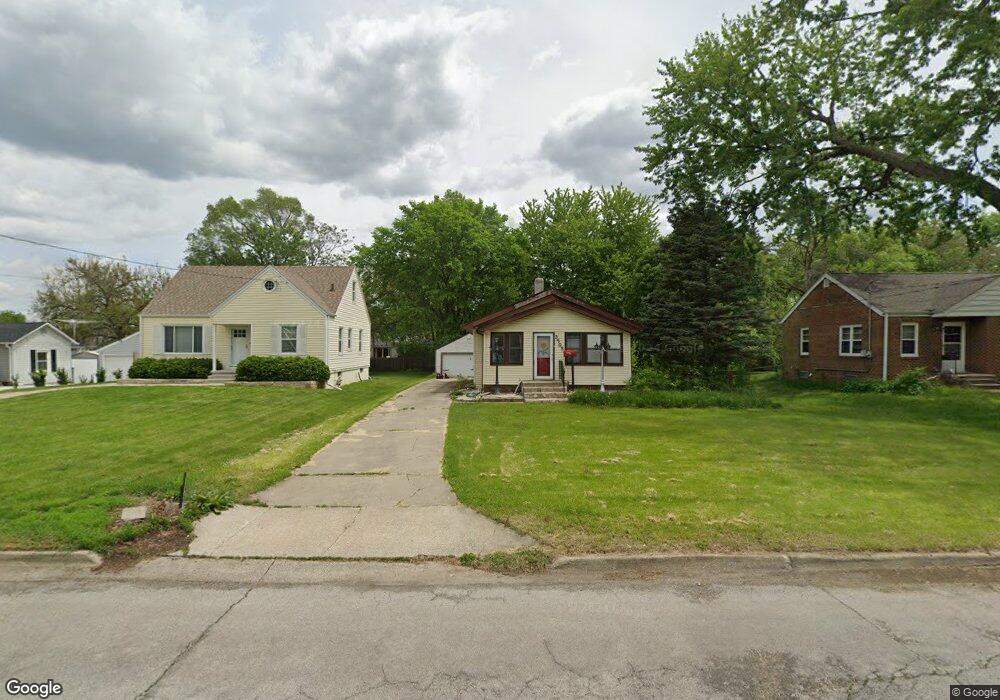
3505 54th St Des Moines, IA 50310
Merle Hay NeighborhoodEstimated Value: $193,000 - $224,000
2
Beds
1
Bath
927
Sq Ft
$224/Sq Ft
Est. Value
About This Home
This home is located at 3505 54th St, Des Moines, IA 50310 and is currently estimated at $207,776, approximately $224 per square foot. 3505 54th St is a home located in Polk County with nearby schools including Moore Elementary School, Meredith Middle School, and Hoover High School.
Ownership History
Date
Name
Owned For
Owner Type
Purchase Details
Closed on
May 21, 2010
Sold by
Mason Kimberly A
Bought by
Jani Ajit
Current Estimated Value
Home Financials for this Owner
Home Financials are based on the most recent Mortgage that was taken out on this home.
Original Mortgage
$69,068
Outstanding Balance
$46,497
Interest Rate
5.14%
Mortgage Type
New Conventional
Estimated Equity
$161,279
Purchase Details
Closed on
Jun 10, 2002
Sold by
Kiernan Peter J and Kiernan Kris D
Bought by
Mason Kimberly A
Home Financials for this Owner
Home Financials are based on the most recent Mortgage that was taken out on this home.
Original Mortgage
$91,083
Interest Rate
5.87%
Purchase Details
Closed on
Jun 29, 1997
Sold by
Backstrom Brian
Bought by
Kiernan Peter J and Kiernan Kris D
Home Financials for this Owner
Home Financials are based on the most recent Mortgage that was taken out on this home.
Original Mortgage
$66,922
Interest Rate
8.01%
Mortgage Type
FHA
Create a Home Valuation Report for This Property
The Home Valuation Report is an in-depth analysis detailing your home's value as well as a comparison with similar homes in the area
Home Values in the Area
Average Home Value in this Area
Purchase History
| Date | Buyer | Sale Price | Title Company |
|---|---|---|---|
| Jani Ajit | $74,500 | None Available | |
| Mason Kimberly A | $93,500 | -- | |
| Kiernan Peter J | $66,500 | -- |
Source: Public Records
Mortgage History
| Date | Status | Borrower | Loan Amount |
|---|---|---|---|
| Open | Jani Ajit | $69,068 | |
| Previous Owner | Mason Kimberly A | $91,083 | |
| Previous Owner | Kiernan Peter J | $66,922 |
Source: Public Records
Tax History Compared to Growth
Tax History
| Year | Tax Paid | Tax Assessment Tax Assessment Total Assessment is a certain percentage of the fair market value that is determined by local assessors to be the total taxable value of land and additions on the property. | Land | Improvement |
|---|---|---|---|---|
| 2025 | $2,194 | $190,500 | $55,000 | $135,500 |
| 2024 | $2,194 | $169,400 | $48,800 | $120,600 |
| 2023 | $2,356 | $169,400 | $48,800 | $120,600 |
| 2022 | $2,330 | $142,400 | $42,400 | $100,000 |
| 2021 | $2,246 | $142,400 | $42,400 | $100,000 |
| 2020 | $2,372 | $130,100 | $39,000 | $91,100 |
| 2019 | $2,054 | $130,100 | $39,000 | $91,100 |
| 2018 | $2,022 | $113,600 | $34,000 | $79,600 |
| 2017 | $1,826 | $113,600 | $34,000 | $79,600 |
| 2016 | $1,754 | $104,500 | $31,000 | $73,500 |
| 2015 | $1,754 | $104,500 | $31,000 | $73,500 |
| 2014 | $1,722 | $91,200 | $27,000 | $64,200 |
Source: Public Records
Map
Nearby Homes