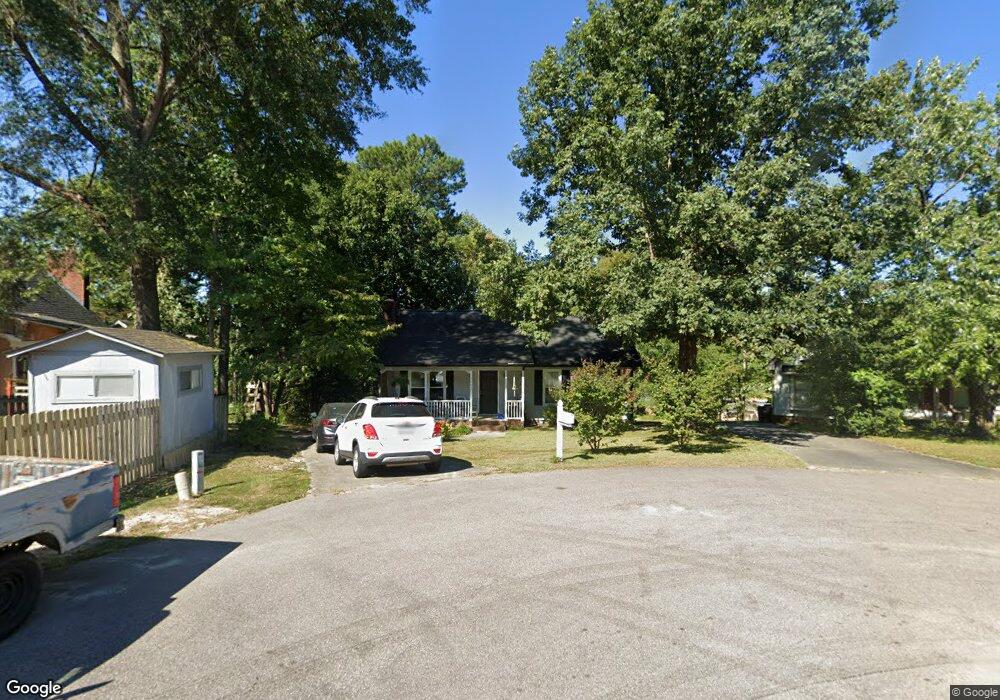
3505 Berdan Ct Raleigh, NC 27616
Forestville NeighborhoodEstimated Value: $243,000 - $290,000
3
Beds
2
Baths
1,290
Sq Ft
$213/Sq Ft
Est. Value
About This Home
This home is located at 3505 Berdan Ct, Raleigh, NC 27616 and is currently estimated at $274,261, approximately $212 per square foot. 3505 Berdan Ct is a home located in Wake County with nearby schools including Harris Creek Elementary School, Rolesville Middle School, and Rolesville High School.
Ownership History
Date
Name
Owned For
Owner Type
Purchase Details
Closed on
Jun 9, 2010
Sold by
Flynn Matthew K and Flynn Theresa M
Bought by
Duebler Lisa L and Duebler Lawrence M
Current Estimated Value
Home Financials for this Owner
Home Financials are based on the most recent Mortgage that was taken out on this home.
Original Mortgage
$114,315
Outstanding Balance
$80,342
Interest Rate
5.99%
Mortgage Type
FHA
Estimated Equity
$193,919
Purchase Details
Closed on
Apr 13, 2005
Sold by
Holland Christopher
Bought by
Flynn Matthew K and Flynn Theresa M
Home Financials for this Owner
Home Financials are based on the most recent Mortgage that was taken out on this home.
Original Mortgage
$84,800
Interest Rate
5.74%
Mortgage Type
Fannie Mae Freddie Mac
Purchase Details
Closed on
Sep 29, 2000
Sold by
Foote Charles N
Bought by
Holland Christopher
Home Financials for this Owner
Home Financials are based on the most recent Mortgage that was taken out on this home.
Original Mortgage
$100,548
Interest Rate
7.92%
Mortgage Type
FHA
Create a Home Valuation Report for This Property
The Home Valuation Report is an in-depth analysis detailing your home's value as well as a comparison with similar homes in the area
Home Values in the Area
Average Home Value in this Area
Purchase History
| Date | Buyer | Sale Price | Title Company |
|---|---|---|---|
| Duebler Lisa L | $121,000 | None Available | |
| Flynn Matthew K | $106,000 | -- | |
| Holland Christopher | $101,000 | -- |
Source: Public Records
Mortgage History
| Date | Status | Borrower | Loan Amount |
|---|---|---|---|
| Open | Duebler Lisa L | $114,315 | |
| Previous Owner | Flynn Matthew K | $84,800 | |
| Previous Owner | Holland Christopher | $100,548 | |
| Closed | Holland Christopher | $3,500 |
Source: Public Records
Tax History
| Year | Tax Paid | Tax Assessment Tax Assessment Total Assessment is a certain percentage of the fair market value that is determined by local assessors to be the total taxable value of land and additions on the property. | Land | Improvement |
|---|---|---|---|---|
| 2025 | $1,742 | $269,238 | $112,500 | $156,738 |
| 2024 | $1,692 | $269,238 | $112,500 | $156,738 |
Source: Public Records
Map
Nearby Homes
- 7916 Mandrel Way
- 3236 Forest Mill Cir
- 3500 Limber Ln
- 7901 River Ridge Rd
- 3421 Tunas St
- 3600 Cadler Ct
- 3605 Iron Sight Ct
- 3624 Iron Sight Ct
- 7319 Great Laurel Dr
- 7248 Great Laurel Dr
- 7924-B Midnight Ln
- 3656 Epperly Ct
- 3509 Pinkham Way
- 3814 Granite Mill Way
- 3822 Granite Mill Way
- 3817 Satinleaf Dr
- 3117 Twatchman Dr
- 4009 Tresco Crossing
- 8317 Hollister Hills Dr
- 3200 Daingerfield Dr
- 3509 Berdan Ct
- 7921 Mandrel Way
- 3501 Berdan Ct
- 7917 Mandrel Way
- 3508 Berdan Ct
- 7929 Mandrel Way
- 3504 Berdan Ct
- 7920 Mandrel Way
- 7933 Mandrel Way
- 7924 Mandrel Way
- 7928 Mandrel Way
- 7937 Mandrel Way
- 7617 Mandrel Way
- 7936 Mandrel Way
- 7941 Mandrel Way
- 3232 Forest Mill Cir
- 3228 Forest Mill Cir
- 3224 Forest Mill Cir
- 3240 Forest Mill Cir
- 3244 Forest Mill Cir
Your Personal Tour Guide
Ask me questions while you tour the home.