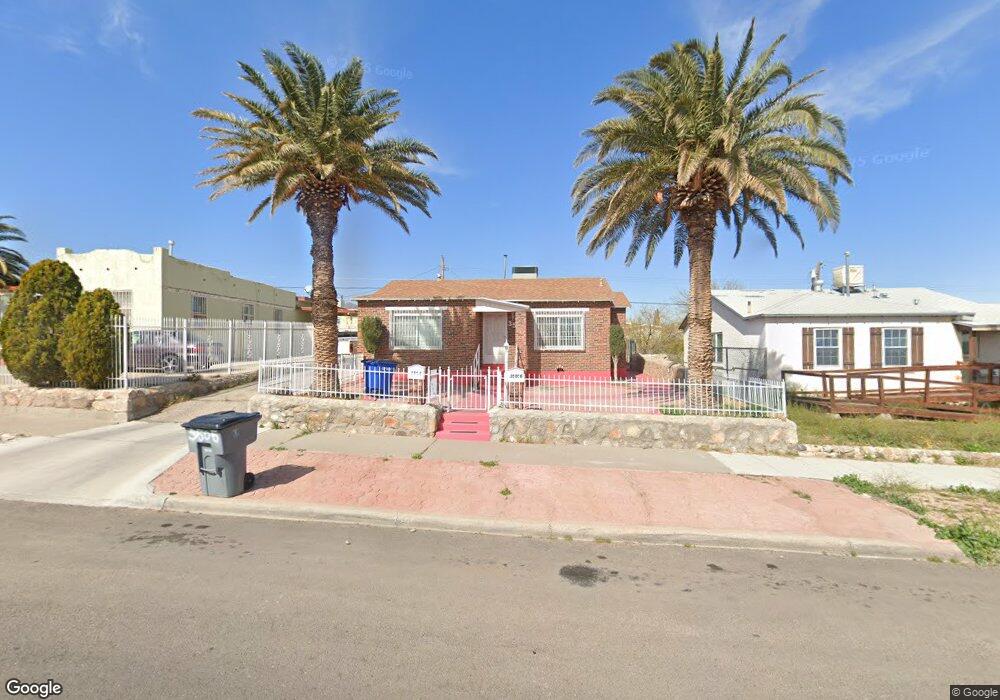
3505 Monroe Ave El Paso, TX 79930
Central NeighborhoodEstimated Value: $208,000 - $255,000
2
Beds
1
Bath
1,590
Sq Ft
$152/Sq Ft
Est. Value
About This Home
This home is located at 3505 Monroe Ave, El Paso, TX 79930 and is currently estimated at $241,692, approximately $152 per square foot. 3505 Monroe Ave is a home located in El Paso County with nearby schools including Rusk Elementary School, Middle School-5 NW Middle, and Austin High School.
Ownership History
Date
Name
Owned For
Owner Type
Purchase Details
Closed on
Nov 6, 2020
Sold by
Moreira Gerardo and Moreira Elda
Bought by
Gerardo J Moreira And Elda I Moreira 2020 Liv and Moreira
Current Estimated Value
Purchase Details
Closed on
Sep 15, 2006
Sold by
Maldonado Soledad and Maldonado Arturo
Bought by
Moreira Gerardo and Moreira Elda
Home Financials for this Owner
Home Financials are based on the most recent Mortgage that was taken out on this home.
Original Mortgage
$65,700
Interest Rate
6.51%
Mortgage Type
Purchase Money Mortgage
Purchase Details
Closed on
Jan 29, 1999
Sold by
Williams Michael R
Bought by
Maldonado Arturo and Maldonado Soledad
Home Financials for this Owner
Home Financials are based on the most recent Mortgage that was taken out on this home.
Original Mortgage
$63,476
Interest Rate
6.85%
Mortgage Type
FHA
Create a Home Valuation Report for This Property
The Home Valuation Report is an in-depth analysis detailing your home's value as well as a comparison with similar homes in the area
Home Values in the Area
Average Home Value in this Area
Purchase History
| Date | Buyer | Sale Price | Title Company |
|---|---|---|---|
| Gerardo J Moreira And Elda I Moreira 2020 Liv | -- | None Listed On Document | |
| Moreira Gerardo | -- | None Available | |
| Maldonado Arturo | -- | -- |
Source: Public Records
Mortgage History
| Date | Status | Borrower | Loan Amount |
|---|---|---|---|
| Previous Owner | Moreira Gerardo | $65,700 | |
| Previous Owner | Maldonado Arturo | $63,476 |
Source: Public Records
Tax History Compared to Growth
Tax History
| Year | Tax Paid | Tax Assessment Tax Assessment Total Assessment is a certain percentage of the fair market value that is determined by local assessors to be the total taxable value of land and additions on the property. | Land | Improvement |
|---|---|---|---|---|
| 2025 | $7,148 | $300,579 | $23,285 | $277,294 |
| 2024 | $7,148 | $275,370 | $23,285 | $252,085 |
| 2023 | $7,148 | $236,539 | $13,860 | $222,679 |
| 2022 | $6,526 | $220,445 | $13,860 | $206,585 |
| 2021 | $5,356 | $171,532 | $13,860 | $157,672 |
| 2020 | $4,808 | $156,416 | $13,860 | $142,556 |
| 2019 | $4,682 | $156,416 | $13,860 | $142,556 |
| 2018 | $4,590 | $155,083 | $13,860 | $141,223 |
| 2017 | $3,926 | $139,367 | $13,860 | $125,507 |
| 2016 | $3,926 | $139,367 | $13,860 | $125,507 |
| 2015 | $4,247 | $151,917 | $13,860 | $138,057 |
| 2014 | $4,247 | $155,202 | $13,860 | $141,342 |
Source: Public Records
Map
Nearby Homes
- 3413 Monroe Ave
- 3704 Mckinley Ave
- 3501 Polk Ave
- 3104 Van Buren Ave
- 3312 Polk Ave
- 3501 Taylor Ave
- 3606 Morehead Ave
- 3806 Mountain Ave
- 3021 Monroe Ave
- 3905 Monroe Ave
- 3831 Mountain Ave
- 3901 Mckinley Ave
- 3027 Morehead Ave
- 3510 Porter Ave
- 3921 Nations Ave
- 3904 N Piedras St Unit A-B
- 3906 Taylor Ave
- 3031 Fort Blvd
- 3427 Hamilton Ave
- 3010 Pierce Ave
- 3501 Monroe Ave
- 3509 Monroe Ave
- 3515 Monroe Ave
- 3504 Van Buren Ave
- 3500 Van Buren Ave
- 3512 Van Buren Ave
- 3429 Monroe Ave
- 3521 Monroe Ave
- 3504 Monroe Ave
- 3510 Monroe Ave
- 3500 Monroe Ave
- 3516 Van Buren Ave
- 3512 Monroe Ave
- 3428 Van Buren Ave
- 3427 Monroe Ave
- 3527 Monroe Ave
- 3520 Monroe Ave
- 3520 Van Buren Ave
- 3430 Monroe Ave