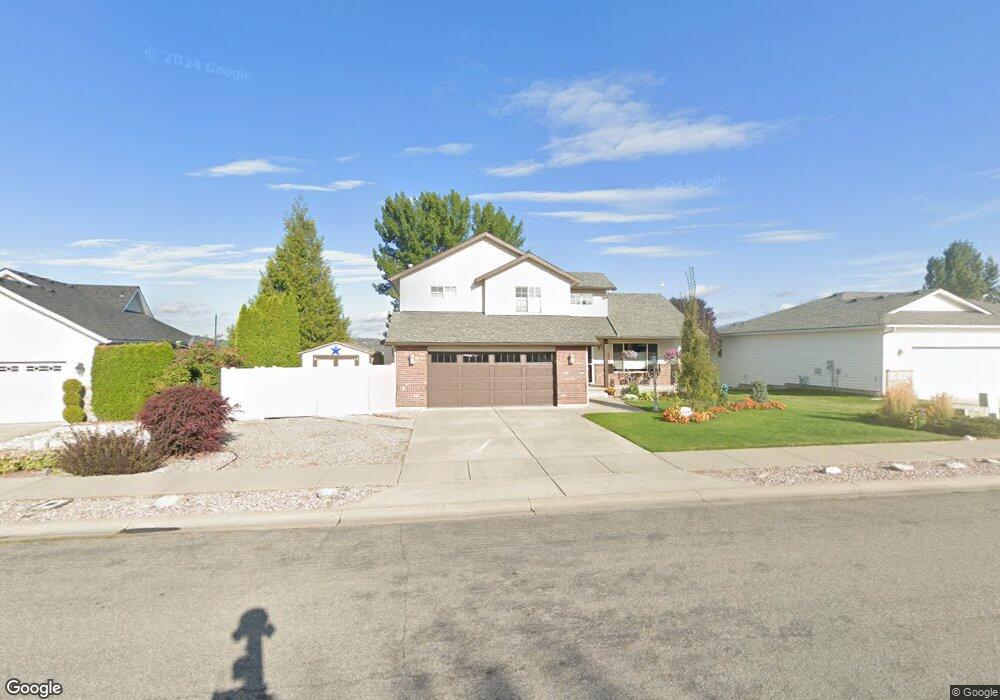
3505 N Ping Rd Post Falls, ID 83854
North Prairie NeighborhoodEstimated Value: $468,000 - $524,000
3
Beds
3
Baths
1,831
Sq Ft
$273/Sq Ft
Est. Value
About This Home
This home is located at 3505 N Ping Rd, Post Falls, ID 83854 and is currently estimated at $499,078, approximately $272 per square foot. 3505 N Ping Rd is a home located in Kootenai County with nearby schools including Mullan Trail Elementary School, Post Falls Middle School, and Post Falls High School.
Ownership History
Date
Name
Owned For
Owner Type
Purchase Details
Closed on
Dec 28, 2016
Sold by
Dow Charles W and Dow Shirley A
Bought by
Helmick Jerry D and Helmick Susan L
Current Estimated Value
Home Financials for this Owner
Home Financials are based on the most recent Mortgage that was taken out on this home.
Original Mortgage
$180,000
Outstanding Balance
$147,954
Interest Rate
4.03%
Mortgage Type
New Conventional
Estimated Equity
$351,124
Create a Home Valuation Report for This Property
The Home Valuation Report is an in-depth analysis detailing your home's value as well as a comparison with similar homes in the area
Home Values in the Area
Average Home Value in this Area
Purchase History
| Date | Buyer | Sale Price | Title Company |
|---|---|---|---|
| Helmick Jerry D | -- | North Idaho Title Company Co |
Source: Public Records
Mortgage History
| Date | Status | Borrower | Loan Amount |
|---|---|---|---|
| Open | Helmick Jerry D | $180,000 |
Source: Public Records
Tax History Compared to Growth
Tax History
| Year | Tax Paid | Tax Assessment Tax Assessment Total Assessment is a certain percentage of the fair market value that is determined by local assessors to be the total taxable value of land and additions on the property. | Land | Improvement |
|---|---|---|---|---|
| 2024 | $1,690 | $426,190 | $152,000 | $274,190 |
| 2023 | $1,690 | $456,125 | $160,000 | $296,125 |
| 2022 | $2,422 | $516,528 | $187,500 | $329,028 |
| 2021 | $2,079 | $328,420 | $125,000 | $203,420 |
| 2020 | $2,132 | $285,030 | $110,000 | $175,030 |
| 2019 | $1,842 | $243,230 | $95,000 | $148,230 |
| 2018 | $1,577 | $210,190 | $75,000 | $135,190 |
| 2017 | $1,470 | $187,530 | $55,000 | $132,530 |
| 2016 | $1,416 | $170,590 | $45,000 | $125,590 |
| 2015 | $1,431 | $169,910 | $40,000 | $129,910 |
| 2013 | $1,390 | $152,540 | $35,000 | $117,540 |
Source: Public Records
Map
Nearby Homes
- 3576 N Blaze Loop
- 3566 N Blaze Loop
- 3556 N Blaze Loop
- 3542 N Blaze Loop
- 3526 N Blaze Loop
- 3510 N Blaze Loop
- 3494 N Blaze Loop
- 3539 N Blaze Loop
- 3523 N Blaze Loop
- 3476 Blaze Loop
- 3509 Blaze Loop
- 3491 Blaze Loop
- 3624 N Blaze Loop
- 0 N Lt 2 Blk 1 Blaze Loop
- Blaze LP Lt2blk1lt 3 10 11 12 13 14blk2
- 3636 N Blaze Loop
- 3397 Blaze Loop
- 355 E Titanium Ct
- 3160 Treaty Rock Blvd
- 3292 N Fireball Ct
- 3515 N Ping Rd
- 3495 N Ping Rd
- 3525 N Ping Rd
- 3500 N Ping Rd
- 3485 N Ping Rd
- 3480 N Ping Rd
- 395 E Tiger Ave
- 385 E Tiger Ave
- 3465 N Ping Rd
- 3535 N Ping Rd
- 375 E Tiger Ave
- 3460 N Ping Rd
- 3435 N Ping Rd
- 365 E Tiger Ave
- 421 E Tiger Ave
- 3430 N Ping Rd
- 3440 N Ping Rd
- 390 E Tiger Ave
- 355 E Tiger Ave
- 400 E Tiger Ave