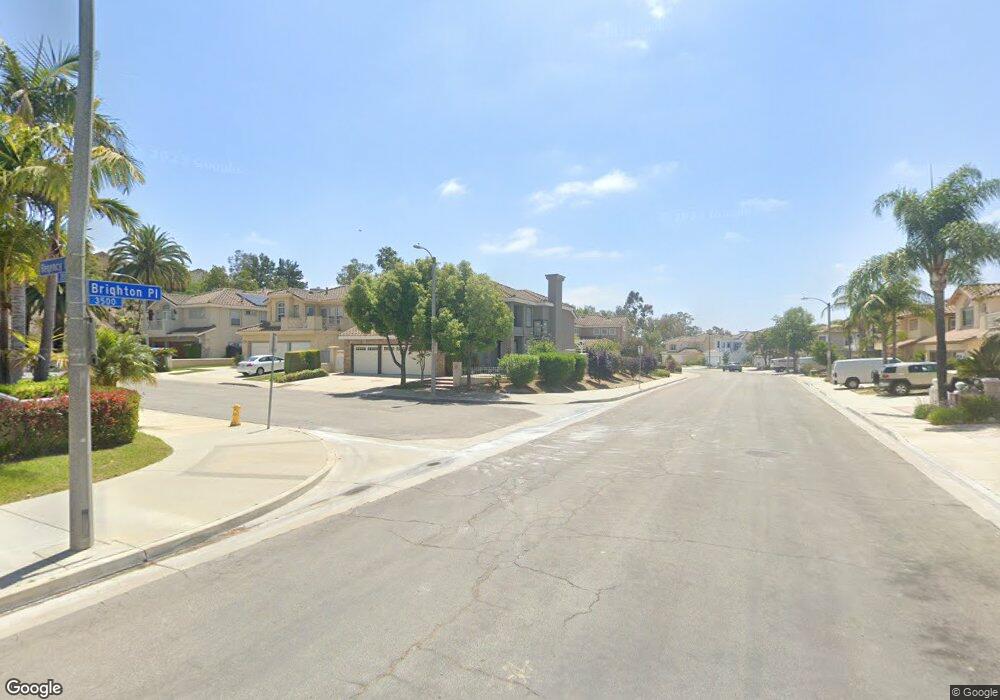
3505 Regency Ct Rowland Heights, CA 91748
Estimated Value: $1,407,369 - $1,515,000
4
Beds
4
Baths
2,981
Sq Ft
$494/Sq Ft
Est. Value
About This Home
This home is located at 3505 Regency Ct, Rowland Heights, CA 91748 and is currently estimated at $1,472,342, approximately $493 per square foot. 3505 Regency Ct is a home located in Los Angeles County with nearby schools including Shelyn Elementary School, Alvarado Intermediate School, and John A. Rowland High School.
Ownership History
Date
Name
Owned For
Owner Type
Purchase Details
Closed on
Dec 6, 1999
Sold by
Nae Wen Kuo
Bought by
Kuo Nae Wen and Yeh Huei Ching
Current Estimated Value
Purchase Details
Closed on
Jul 13, 1998
Sold by
Diep Minh and Lam Janet
Bought by
Kuo Nae Wen
Purchase Details
Closed on
Apr 23, 1998
Sold by
Zhang Ke Jian and Yang Pei Jun
Bought by
Diep Minh and Lam Janet
Home Financials for this Owner
Home Financials are based on the most recent Mortgage that was taken out on this home.
Original Mortgage
$289,650
Interest Rate
7.13%
Purchase Details
Closed on
Mar 18, 1997
Sold by
Jui Chih Hsu Yuan and Jui Jo Li
Bought by
Zhang Ke Jian and Yang Pei Jun
Home Financials for this Owner
Home Financials are based on the most recent Mortgage that was taken out on this home.
Original Mortgage
$214,600
Interest Rate
7.87%
Create a Home Valuation Report for This Property
The Home Valuation Report is an in-depth analysis detailing your home's value as well as a comparison with similar homes in the area
Home Values in the Area
Average Home Value in this Area
Purchase History
| Date | Buyer | Sale Price | Title Company |
|---|---|---|---|
| Kuo Nae Wen | -- | -- | |
| Kuo Nae Wen | $363,000 | Chicago Title Co | |
| Diep Minh | $362,500 | South Coast Title | |
| Zhang Ke Jian | $325,000 | -- |
Source: Public Records
Mortgage History
| Date | Status | Borrower | Loan Amount |
|---|---|---|---|
| Previous Owner | Diep Minh | $289,650 | |
| Previous Owner | Zhang Ke Jian | $214,600 | |
| Closed | Diep Minh | $54,300 |
Source: Public Records
Tax History Compared to Growth
Tax History
| Year | Tax Paid | Tax Assessment Tax Assessment Total Assessment is a certain percentage of the fair market value that is determined by local assessors to be the total taxable value of land and additions on the property. | Land | Improvement |
|---|---|---|---|---|
| 2025 | $7,327 | $569,055 | $191,090 | $377,965 |
| 2024 | $7,327 | $557,898 | $187,344 | $370,554 |
| 2023 | $7,037 | $546,960 | $183,671 | $363,289 |
| 2022 | $6,832 | $536,236 | $180,070 | $356,166 |
| 2021 | $6,708 | $525,723 | $176,540 | $349,183 |
| 2019 | $6,505 | $510,131 | $171,304 | $338,827 |
| 2018 | $6,233 | $500,130 | $167,946 | $332,184 |
| 2016 | $9,109 | $480,711 | $161,425 | $319,286 |
| 2015 | $8,997 | $473,492 | $159,001 | $314,491 |
| 2014 | $8,703 | $464,218 | $155,887 | $308,331 |
Source: Public Records
Map
Nearby Homes
- 18109 Graystone Way
- 18489 Stonegate Ln
- 18559 Stonegate Ln
- 18555 Fieldbrook St
- 1010 Northwood Ave
- 18593 Fieldbrook St
- 1006 W Dorothy Dr
- 2190 Choral Dr
- 2503 Toro Dr
- 2426 Batson Ave
- 1318 Alta Mesa Dr
- 1060 Tropicana Way
- 2503 Donosa Dr
- 2521 Doubletree Ln
- 2634 Blandford Dr
- 3038 Blakeman Ave
- 1223 El Encanto Dr
- 1929 Coban Rd
- 18220 Gallineta St
- 18536 Mescal St
- 3509 Regency Ct
- 3532 Brighton Place
- 3527 Brighton Place
- 3523 Brighton Place
- 3540 Brighton Place
- 3506 Regency Ct
- 3515 Regency Ct
- 3533 Brighton Place
- 3510 Regency Ct
- 3513 Brighton Place
- 3537 Brighton Place
- 3516 Regency Ct
- 3550 Brighton Place
- 3507 Brighton Place
- 3541 Brighton Place
- 3502 Brighton Place
- 3503 Brighton Place
- 3545 Brighton Place
- 3526 Hertford Place
- 3549 Brighton Place