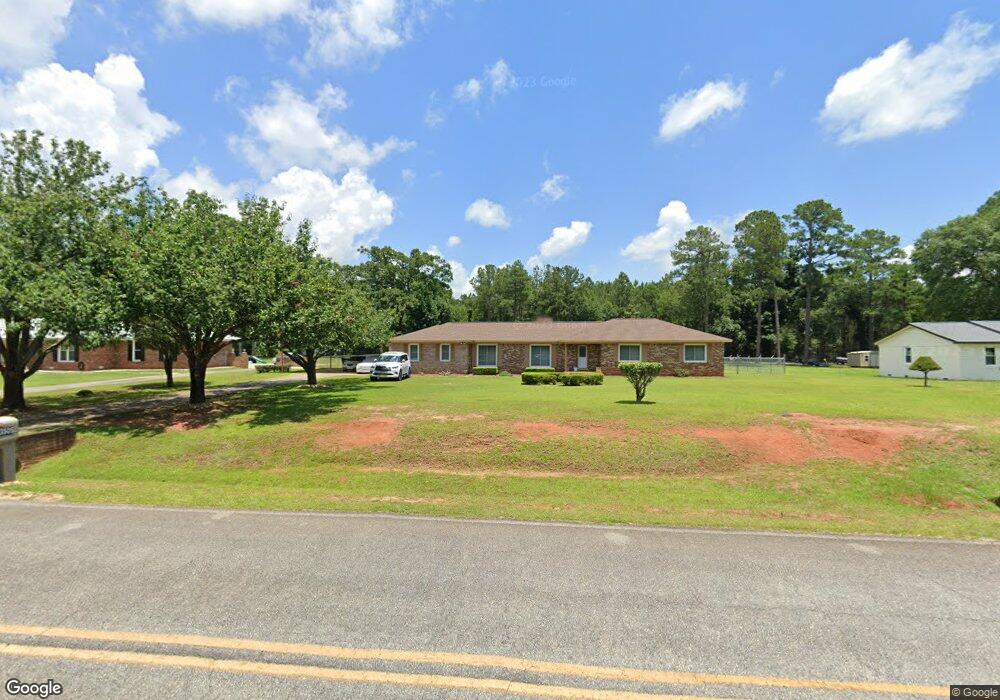
3505 Shannon Rd Albany, GA 31721
Estimated Value: $207,000 - $261,000
4
Beds
2
Baths
2,416
Sq Ft
$97/Sq Ft
Est. Value
About This Home
This home is located at 3505 Shannon Rd, Albany, GA 31721 and is currently estimated at $233,419, approximately $96 per square foot. 3505 Shannon Rd is a home located in Dougherty County with nearby schools including Live Oak Elementary School, Merry Acres Middle School, and Westover High School.
Ownership History
Date
Name
Owned For
Owner Type
Purchase Details
Closed on
Feb 24, 2003
Sold by
Ravin Otis Jr Family Trust
Bought by
Ravin Otis and Ravin Velma S
Current Estimated Value
Purchase Details
Closed on
Jan 25, 2001
Sold by
Raven Otis and Raven Velma S
Bought by
Ravin Otis Jr Family Trust
Purchase Details
Closed on
Apr 23, 1998
Sold by
Burke Charles Dean and Lisa Tobin
Bought by
Raven Otis and Raven Velma S
Purchase Details
Closed on
Apr 26, 1996
Sold by
Nichols Earl
Bought by
Burke Charles Dean and Lisa Tobin
Purchase Details
Closed on
Apr 12, 1995
Sold by
Hunter Robin S
Bought by
Nichols Earl
Purchase Details
Closed on
Oct 30, 1992
Sold by
Solberg Donald and M J
Bought by
Hunter Robin S
Purchase Details
Closed on
Oct 4, 1980
Sold by
Raid Walter and A P
Bought by
Solberg Donald and Solberg Mary
Create a Home Valuation Report for This Property
The Home Valuation Report is an in-depth analysis detailing your home's value as well as a comparison with similar homes in the area
Home Values in the Area
Average Home Value in this Area
Purchase History
| Date | Buyer | Sale Price | Title Company |
|---|---|---|---|
| Ravin Otis | -- | -- | |
| Ravin Otis Jr Family Trust | -- | -- | |
| Raven Otis | $139,000 | -- | |
| Burke Charles Dean | $98,000 | -- | |
| Nichols Earl | $83,000 | -- | |
| Hunter Robin S | $83,000 | -- | |
| Solberg Donald | -- | -- |
Source: Public Records
Tax History Compared to Growth
Tax History
| Year | Tax Paid | Tax Assessment Tax Assessment Total Assessment is a certain percentage of the fair market value that is determined by local assessors to be the total taxable value of land and additions on the property. | Land | Improvement |
|---|---|---|---|---|
| 2024 | $2,890 | $66,845 | $12,080 | $54,765 |
| 2023 | $1,981 | $66,845 | $12,080 | $54,765 |
| 2022 | $2,830 | $66,845 | $12,080 | $54,765 |
| 2021 | $2,616 | $66,845 | $12,080 | $54,765 |
| 2020 | $2,622 | $66,845 | $12,080 | $54,765 |
| 2019 | $2,631 | $66,845 | $12,080 | $54,765 |
| 2018 | $2,642 | $66,845 | $12,080 | $54,765 |
| 2017 | $2,454 | $66,845 | $12,080 | $54,765 |
| 2016 | $2,455 | $66,845 | $12,080 | $54,765 |
| 2015 | $2,459 | $66,845 | $12,080 | $54,765 |
| 2014 | $2,448 | $67,440 | $12,680 | $54,760 |
Source: Public Records
Map
Nearby Homes
- 3408 Forest Ridge Dr
- 134 Hollister Dr
- 171 Hollister Dr
- 2738 Dover Ln
- 127 Cambridge Rd
- 2600 Shannon Rd
- N/A N Doublegate Dr
- 316 N Doublegate Dr
- 150 Hugh Rd
- 274 N Doublegate Dr
- 245 N Doublegate Dr
- 2707 Somerset Dr
- 219 Somerset Dr
- 3101 Old Dawson Rd
- 157 Story Ln
- 2715 N Doublegate Dr
- 2511 Wexford Dr
- 143 Story Ln
- 2527 Brookhaven Ct
- 0 W Hwy 82
- 3507 Shannon Rd
- 3503 Shannon Rd
- 3509 Shannon Rd
- 3501 Shannon Rd
- 2719 Brittany Rd
- 244 Berkeley Rd
- 2718 Brittany Rd
- 240 Berkeley Rd
- 3511 Shannon Rd
- 2717 Brittany Rd
- 2900 Shannon Rd
- 236 Berkeley Rd
- 2716 Brittany Rd
- 2718 Abbey Ln
- 3419 Forest Ridge Dr
- 232 Berkeley Rd
- 245 Berkeley Rd
- 3513 Shannon Rd
- 3417 Forest Ridge Dr
- 2715 Brittany Rd