3506 Wasatch Dr Unit 1 Redding, CA 96001
Ridgeview NeighborhoodEstimated Value: $425,000 - $521,000
3
Beds
2
Baths
1,764
Sq Ft
$264/Sq Ft
Est. Value
About This Home
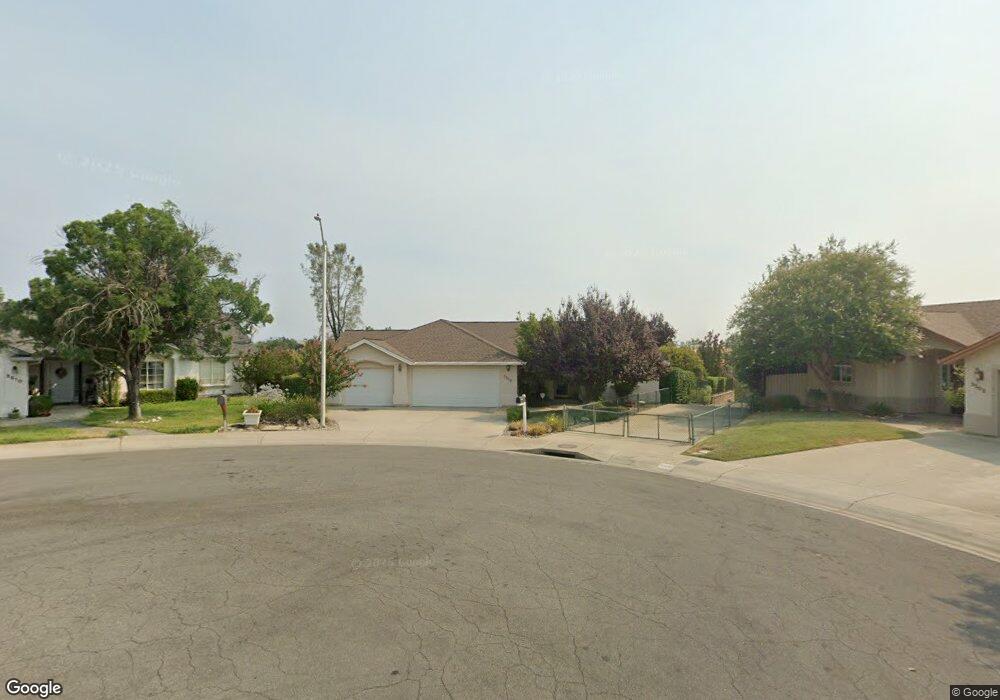
This home is located at 3506 Wasatch Dr Unit 1, Redding, CA 96001 and is currently estimated at $464,994, approximately $263 per square foot. 3506 Wasatch Dr Unit 1 is a home located in Shasta County with nearby schools including Manzanita Elementary School, Sequoia Middle School, and Shasta High School.
Ownership History
Date
Name
Owned For
Owner Type
Purchase Details
Closed on
Aug 9, 2019
Sold by
Logan Michael B and Logan Teresa J
Bought by
Logan Michael B and Logan Teresa J
Current Estimated Value
Purchase Details
Closed on
Apr 27, 2001
Sold by
Golde David
Bought by
Logan Michael B and Logan Terri J
Home Financials for this Owner
Home Financials are based on the most recent Mortgage that was taken out on this home.
Original Mortgage
$185,130
Outstanding Balance
$68,564
Interest Rate
6.92%
Mortgage Type
VA
Estimated Equity
$396,430
Purchase Details
Closed on
Mar 20, 1998
Sold by
Parsons Jack D and Parsons Virginia A
Bought by
Golde David
Home Financials for this Owner
Home Financials are based on the most recent Mortgage that was taken out on this home.
Original Mortgage
$142,500
Interest Rate
7.06%
Create a Home Valuation Report for This Property
The Home Valuation Report is an in-depth analysis detailing your home's value as well as a comparison with similar homes in the area
Home Values in the Area
Average Home Value in this Area
Purchase History
| Date | Buyer | Sale Price | Title Company |
|---|---|---|---|
| Logan Michael B | -- | None Available | |
| Logan Michael B | $181,500 | Fidelity National Title Co | |
| Golde David | $168,000 | Fidelity National Title Co |
Source: Public Records
Mortgage History
| Date | Status | Borrower | Loan Amount |
|---|---|---|---|
| Open | Logan Michael B | $185,130 | |
| Previous Owner | Golde David | $142,500 |
Source: Public Records
Tax History
| Year | Tax Paid | Tax Assessment Tax Assessment Total Assessment is a certain percentage of the fair market value that is determined by local assessors to be the total taxable value of land and additions on the property. | Land | Improvement |
|---|---|---|---|---|
| 2025 | $3,188 | $305,941 | $57,246 | $248,695 |
| 2024 | $3,137 | $299,943 | $56,124 | $243,819 |
| 2023 | $3,137 | $294,063 | $55,024 | $239,039 |
| 2022 | $3,083 | $288,298 | $53,946 | $234,352 |
| 2021 | $3,060 | $282,646 | $52,889 | $229,757 |
| 2020 | $2,936 | $265,056 | $52,347 | $212,709 |
| 2019 | $2,633 | $245,154 | $51,321 | $193,833 |
| 2018 | $2,653 | $240,348 | $50,315 | $190,033 |
| 2017 | $2,636 | $235,636 | $49,329 | $186,307 |
| 2016 | $2,553 | $231,016 | $48,362 | $182,654 |
| 2015 | $2,485 | $227,547 | $47,636 | $179,911 |
| 2014 | $2,498 | $223,090 | $46,703 | $176,387 |
Source: Public Records
Map
Nearby Homes
- 2135 Adirondack Dr
- 3380 Placer St
- 2358 Cumberland Dr
- 3882 Fujiyama Way
- 4065 Meander Dr
- 2242 Everest Dr
- 3701 Cal Ore Dr
- 4125 Oro St
- 1525 Oak St
- 3345 Oakwood Place
- 1355 Bambury Ct
- 4160 Travona Ct
- 1695 Kildare Dr
- 1846 Kildare Dr
- 1783 Record Ln
- 1692 Kildare Dr
- 1426 Gladstone Ct
- 1854 Mary Lake Dr
- 1974 Kildare Dr
- 1756 Mary Lake Dr
- 3506 Wasatch Dr
- 3510 Wasatch Dr Unit 1
- 3510 Wasatch Dr
- 3502 Wasatch Dr Unit 1
- 3502 Wasatch Dr
- 3278 Wasatch Dr
- 3503 Wasatch Dr
- 3514 Wasatch Dr
- 3520 Wasatch Dr
- 3507 Wasatch Dr Unit 1
- 3507 Wasatch Dr
- 3511 Wasatch Dr Unit 1
- 3511 Wasatch Dr
- 3554 Wasatch Dr
- 3515 Wasatch Dr
- 3566 Wasatch Dr
- 3533 Wasatch Dr
- 3561 Wasatch Dr
- 3547 Wasatch Dr
- 3578 Wasatch Dr
Your Personal Tour Guide
Ask me questions while you tour the home.