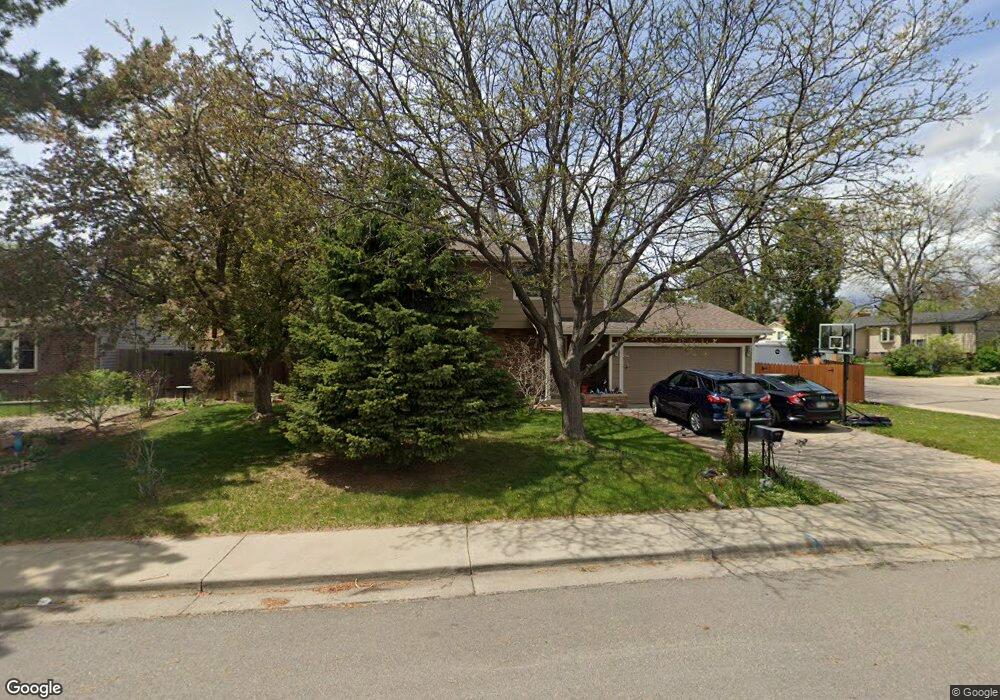
3507 Apple Ave Loveland, CO 80538
Estimated Value: $445,115 - $505,000
4
Beds
3
Baths
2,432
Sq Ft
$193/Sq Ft
Est. Value
About This Home
This home is located at 3507 Apple Ave, Loveland, CO 80538 and is currently estimated at $469,529, approximately $193 per square foot. 3507 Apple Ave is a home located in Larimer County with nearby schools including Lincoln Elementary School, Lucile Erwin Middle School, and Loveland High School.
Ownership History
Date
Name
Owned For
Owner Type
Purchase Details
Closed on
Feb 11, 2003
Sold by
Perna Joanne
Bought by
Frisch Robert A and Frisch Catherine E
Current Estimated Value
Home Financials for this Owner
Home Financials are based on the most recent Mortgage that was taken out on this home.
Original Mortgage
$135,000
Outstanding Balance
$57,353
Interest Rate
5.84%
Mortgage Type
Purchase Money Mortgage
Estimated Equity
$412,176
Purchase Details
Closed on
Aug 29, 2002
Sold by
Dobson Richard A and Dobson Shelley L
Bought by
Perna Joanne
Purchase Details
Closed on
Feb 14, 1997
Sold by
Hopwood Lynn A
Bought by
Dobson Richard A and Dobson Shelley L
Home Financials for this Owner
Home Financials are based on the most recent Mortgage that was taken out on this home.
Original Mortgage
$72,000
Interest Rate
7.85%
Create a Home Valuation Report for This Property
The Home Valuation Report is an in-depth analysis detailing your home's value as well as a comparison with similar homes in the area
Home Values in the Area
Average Home Value in this Area
Purchase History
| Date | Buyer | Sale Price | Title Company |
|---|---|---|---|
| Frisch Robert A | $215,000 | North American Title Co | |
| Perna Joanne | $194,775 | North American Title Co | |
| Dobson Richard A | $132,000 | -- |
Source: Public Records
Mortgage History
| Date | Status | Borrower | Loan Amount |
|---|---|---|---|
| Open | Frisch Robert A | $135,000 | |
| Previous Owner | Dobson Richard A | $72,000 |
Source: Public Records
Tax History Compared to Growth
Tax History
| Year | Tax Paid | Tax Assessment Tax Assessment Total Assessment is a certain percentage of the fair market value that is determined by local assessors to be the total taxable value of land and additions on the property. | Land | Improvement |
|---|---|---|---|---|
| 2025 | $2,207 | $31,336 | $3,015 | $28,321 |
| 2024 | $2,128 | $31,336 | $3,015 | $28,321 |
| 2022 | $1,999 | $25,118 | $3,128 | $21,990 |
| 2021 | $2,054 | $25,841 | $3,218 | $22,623 |
| 2020 | $1,987 | $24,990 | $3,218 | $21,772 |
| 2019 | $1,953 | $24,990 | $3,218 | $21,772 |
| 2018 | $1,485 | $18,043 | $3,240 | $14,803 |
| 2017 | $1,279 | $18,043 | $3,240 | $14,803 |
| 2016 | $1,117 | $15,235 | $3,582 | $11,653 |
| 2015 | $1,108 | $15,230 | $3,580 | $11,650 |
| 2014 | $1,086 | $14,440 | $3,580 | $10,860 |
Source: Public Records
Map
Nearby Homes
- 3621 Adena Ct
- 1463 Caddoa Dr
- 1221 Bay Ct
- 717 W 36th St
- 2922 Alamosa Ct
- 4056 Boxelder Dr
- 3312 N Colorado Ave
- 3523 N Franklin Ave
- 3210 N Colorado Ave
- 1532 Oak Creek Dr
- 4150 Ebony Ct
- 1555 Oak Creek Dr
- 3110 N Franklin Ave
- 3679 Wild Horse Ct Unit 3679
- 3750 Sheridan Ave
- 706 W 29th St
- 4019 Burr Oak Dr
- 3321 Butternut Dr
- 1534 W 28th St
- 4403 Shubert Dr