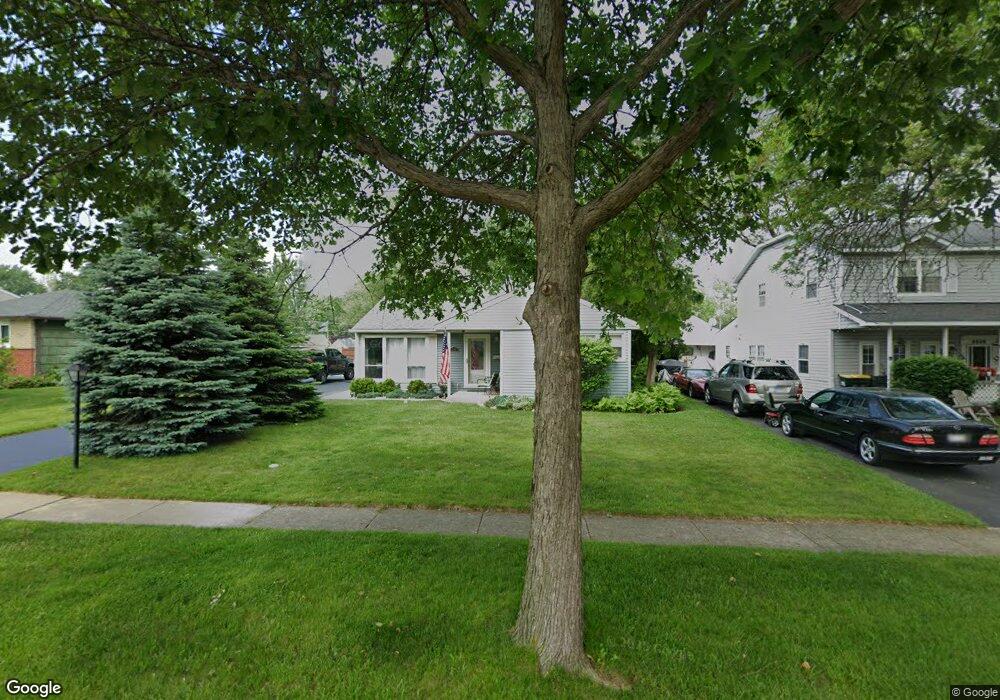
3508 Bobolink Ln Rolling Meadows, IL 60008
Estimated Value: $312,000 - $390,000
3
Beds
2
Baths
1,055
Sq Ft
$320/Sq Ft
Est. Value
About This Home
This home is located at 3508 Bobolink Ln, Rolling Meadows, IL 60008 and is currently estimated at $337,813, approximately $320 per square foot. 3508 Bobolink Ln is a home located in Cook County with nearby schools including Central Road Elementary School, Gale School, and King Elementary School.
Ownership History
Date
Name
Owned For
Owner Type
Purchase Details
Closed on
Dec 20, 2004
Sold by
Riggle Lisa J
Bought by
Reid Simon
Current Estimated Value
Home Financials for this Owner
Home Financials are based on the most recent Mortgage that was taken out on this home.
Original Mortgage
$217,400
Outstanding Balance
$109,164
Interest Rate
5.77%
Mortgage Type
Unknown
Estimated Equity
$228,649
Purchase Details
Closed on
Jun 27, 2001
Sold by
Bollmann Robert H and Bollman Donna G
Bought by
Riggle Lisa J and Riggle Richard J
Home Financials for this Owner
Home Financials are based on the most recent Mortgage that was taken out on this home.
Original Mortgage
$159,300
Interest Rate
7.18%
Purchase Details
Closed on
Sep 6, 2000
Sold by
Bollmann Robert H and Bollmann Donna G
Bought by
Bollmann Robert H and Bollmann Donna G
Create a Home Valuation Report for This Property
The Home Valuation Report is an in-depth analysis detailing your home's value as well as a comparison with similar homes in the area
Home Values in the Area
Average Home Value in this Area
Purchase History
| Date | Buyer | Sale Price | Title Company |
|---|---|---|---|
| Reid Simon | $229,000 | Multiple | |
| Riggle Lisa J | $177,000 | First American Title | |
| Bollmann Robert H | -- | -- |
Source: Public Records
Mortgage History
| Date | Status | Borrower | Loan Amount |
|---|---|---|---|
| Open | Reid Simon | $217,400 | |
| Previous Owner | Riggle Lisa J | $159,300 |
Source: Public Records
Tax History Compared to Growth
Tax History
| Year | Tax Paid | Tax Assessment Tax Assessment Total Assessment is a certain percentage of the fair market value that is determined by local assessors to be the total taxable value of land and additions on the property. | Land | Improvement |
|---|---|---|---|---|
| 2024 | $6,033 | $23,000 | $4,872 | $18,128 |
| 2023 | $5,747 | $23,000 | $4,872 | $18,128 |
| 2022 | $5,747 | $23,000 | $4,872 | $18,128 |
| 2021 | $5,222 | $19,100 | $2,878 | $16,222 |
| 2020 | $5,173 | $19,100 | $2,878 | $16,222 |
| 2019 | $5,211 | $21,341 | $2,878 | $18,463 |
| 2018 | $4,874 | $18,483 | $2,657 | $15,826 |
| 2017 | $4,794 | $18,483 | $2,657 | $15,826 |
| 2016 | $4,725 | $18,483 | $2,657 | $15,826 |
| 2015 | $4,234 | $16,071 | $2,435 | $13,636 |
| 2014 | $4,150 | $16,071 | $2,435 | $13,636 |
| 2013 | $4,032 | $16,071 | $2,435 | $13,636 |
Source: Public Records
Map
Nearby Homes
- 3600 Owl Dr
- 3355 Kirchoff Rd Unit 6A
- 3265 Kirchoff Rd Unit 223
- 3400 Wellington Ct Unit 306
- 3125 Town Square Dr Unit 408
- 4101 Owl Dr
- 1 Foxcroft on Auburn
- 3316 Trillium Cir
- 4209 Owl Dr
- 372 Longacres Ln
- 3805 Fairfax Ave
- 208 Brookdale Ln
- 2600 Brookwood Way Dr Unit 316
- 2600 Brookwood Way Dr Unit 305
- 2600 Brookwood Unit 314
- 2600 Brookwood Way Dr Unit 212
- 2611 South St
- 3208 Wren Ln
- 200 Edgewood Ln
- 2401 Rohlwing Rd
- 3506 Bobolink Ln
- 3600 Bobolink Ln
- 3507 Mallard Ct
- 3511 Mallard Ct
- 3505 Mallard Ct
- 3502 Bobolink Ln
- 3509 Bobolink Ln
- 3601 Bobolink Ln
- 3507 Bobolink Ln
- 3503 Mallard Ct
- 3603 Bobolink Ln
- 3505 Bobolink Ln
- 3403 Owl Dr
- 3403 Owl Dr
- 3404 Bobolink Ln
- 3515 Mallard Ct
- 3605 Bobolink Ln
- 3503 Bobolink Ln
- 3503 Bobolink Ln Unit 1
- 3607 Bobolink Ln