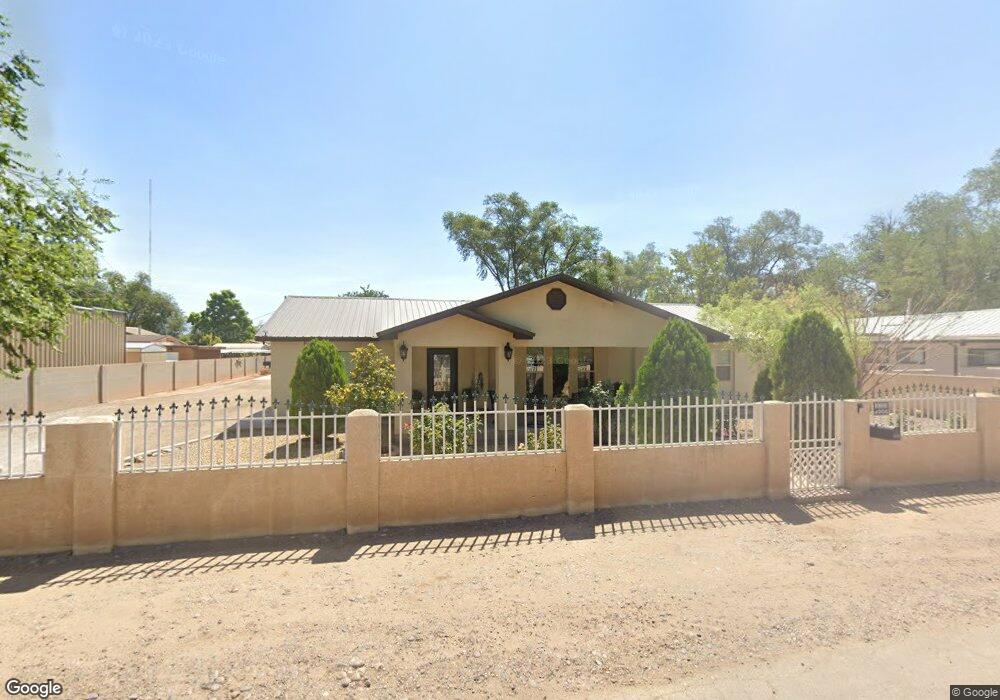
3508 Chalmers Rd SW Albuquerque, NM 87105
Estimated Value: $306,000 - $373,000
3
Beds
2
Baths
1,794
Sq Ft
$191/Sq Ft
Est. Value
About This Home
This home is located at 3508 Chalmers Rd SW, Albuquerque, NM 87105 and is currently estimated at $343,181, approximately $191 per square foot. 3508 Chalmers Rd SW is a home located in Bernalillo County with nearby schools including Mountain View Elementary School, Polk Middle School, and Rio Grande High School.
Ownership History
Date
Name
Owned For
Owner Type
Purchase Details
Closed on
Aug 28, 2024
Sold by
Pena Isidro and Pena Aurora
Bought by
Chaparro Erica T and Castro Sergio I
Current Estimated Value
Purchase Details
Closed on
Jan 18, 2017
Sold by
Pena Aurora
Bought by
Pena Isidro and Pena Aurora
Home Financials for this Owner
Home Financials are based on the most recent Mortgage that was taken out on this home.
Original Mortgage
$88,400
Interest Rate
4.13%
Mortgage Type
New Conventional
Purchase Details
Closed on
Oct 28, 2005
Sold by
Maldonado Socorro and Rivas Miguel
Bought by
Pena Aurora
Home Financials for this Owner
Home Financials are based on the most recent Mortgage that was taken out on this home.
Original Mortgage
$156,750
Interest Rate
5.73%
Mortgage Type
Fannie Mae Freddie Mac
Create a Home Valuation Report for This Property
The Home Valuation Report is an in-depth analysis detailing your home's value as well as a comparison with similar homes in the area
Home Values in the Area
Average Home Value in this Area
Purchase History
| Date | Buyer | Sale Price | Title Company |
|---|---|---|---|
| Chaparro Erica T | -- | Old Republic National Title In | |
| Pena Isidro | -- | None Available | |
| Pena Aurora | -- | First American Title Ins Co | |
| Rivas Miguel | -- | First American Title Ins Co |
Source: Public Records
Mortgage History
| Date | Status | Borrower | Loan Amount |
|---|---|---|---|
| Previous Owner | Pena Isidro | $88,400 | |
| Previous Owner | Pena Aurora | $156,750 |
Source: Public Records
Tax History Compared to Growth
Tax History
| Year | Tax Paid | Tax Assessment Tax Assessment Total Assessment is a certain percentage of the fair market value that is determined by local assessors to be the total taxable value of land and additions on the property. | Land | Improvement |
|---|---|---|---|---|
| 2024 | $2,306 | $62,144 | $12,575 | $49,569 |
| 2023 | $2,265 | $60,335 | $12,209 | $48,126 |
| 2022 | $2,132 | $58,578 | $11,854 | $46,724 |
| 2021 | $2,062 | $56,872 | $11,509 | $45,363 |
| 2020 | $1,876 | $51,170 | $11,174 | $39,996 |
| 2019 | $1,821 | $49,680 | $10,849 | $38,831 |
| 2018 | $1,758 | $49,680 | $10,849 | $38,831 |
| 2017 | $1,692 | $48,234 | $10,533 | $37,701 |
| 2016 | $1,629 | $45,466 | $9,929 | $35,537 |
| 2015 | $44,142 | $44,142 | $9,640 | $34,502 |
| 2014 | $1,507 | $42,856 | $9,359 | $33,497 |
| 2013 | -- | $41,608 | $9,087 | $32,521 |
Source: Public Records
Map
Nearby Homes
- 3601 Big Cottonwood Dr
- 3641 Cameo Dr SE
- 308 Gore Ave SE
- 4307 Wallace St SE
- 4303 Kennard Ave SE
- 4312 March St SE
- 3742 Isleta Blvd SW
- 1728 Valley Rd SW
- 1723 Valley Rd SW
- 1519 Bonito Rd SW
- 1639 Ferris Ave SW
- 1319 La Vega Dr SW
- 1516 1 2 Gallegos Rd SW
- 3820 Beall Ct SW
- 1427 Vito Romero Rd SW
- 1431 Tierra Verde Place SW
- 4001 Donald Rd SW
- 2912 William St SE
- 1905 Lakeview Rd SW
- 2031 Sanford Ave SW
- 3512 Chalmers Rd SW
- 3504 Chalmers Rd SW
- 0 Hale Cir SW Unit 219976
- 0 Hale Cir SW Unit 95565
- 3515 Chalmers Rd SW
- 0 Chalmers St SW Unit 36161
- 0 Chalmers St SW
- 3507 Chalmers St SW
- 3516 Chalmers Rd SW
- 3503 Chalmers St SW
- 235 Hale Cir SW
- 313 Hale Cir SW
- 233 Hale Cir SW
- 401 Hale Cir SW
- 237 Hale Cir SW
- 405 Hale Cir SW
- 307 Rossmoor Ave SW
- 309 Hale Cir SW
- 231 Hale Cir SW
- 317 Hale Cir SW