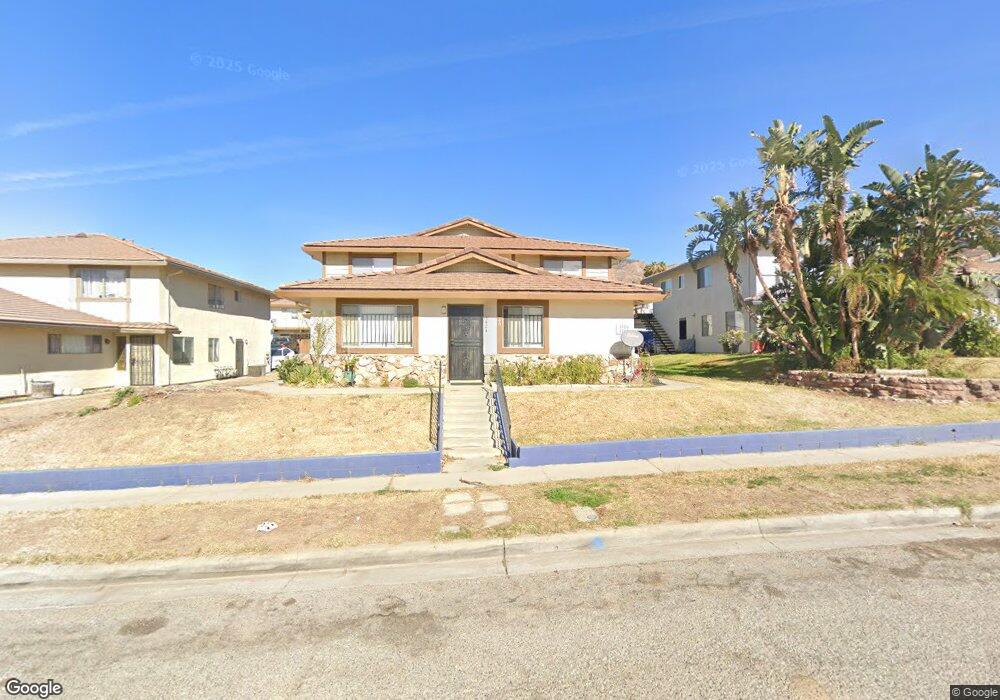
3508 Rainbow Ln Highland, CA 92346
San Andreas NeighborhoodEstimated Value: $169,000 - $201,000
2
Beds
1
Bath
882
Sq Ft
$210/Sq Ft
Est. Value
About This Home
This home is located at 3508 Rainbow Ln, Highland, CA 92346 and is currently estimated at $185,246, approximately $210 per square foot. 3508 Rainbow Ln is a home located in San Bernardino County with nearby schools including Bonnie Oehl Elementary School, Serrano Middle School, and San Gorgonio High School.
Ownership History
Date
Name
Owned For
Owner Type
Purchase Details
Closed on
Feb 27, 2009
Sold by
Patel Jashubhai L
Bought by
Jp Rainbow Investments Llc
Current Estimated Value
Purchase Details
Closed on
Dec 26, 2008
Sold by
Jp Morgan Chase Bank National Associatio
Bought by
Patel Jashubhai L
Purchase Details
Closed on
Dec 18, 2008
Sold by
Patel Pushpa J
Bought by
Patel Jashubhal L
Purchase Details
Closed on
Dec 10, 2008
Sold by
Federal Deposit Insurance Corporation
Bought by
Jpmorgan Chase Bank National Association
Purchase Details
Closed on
Apr 22, 2008
Sold by
Lopez Juan
Bought by
Washington Mutual Bank and Long Beach Mortgage Co
Purchase Details
Closed on
May 11, 2006
Sold by
Halcromb Brian L
Bought by
Lopez Juan and Lopez Olga
Create a Home Valuation Report for This Property
The Home Valuation Report is an in-depth analysis detailing your home's value as well as a comparison with similar homes in the area
Home Values in the Area
Average Home Value in this Area
Purchase History
We collect this data history from publicly available records. To have your information removed, we recommend requesting removal directly through your county’s website.
| Date | Buyer | Sale Price | Title Company |
|---|---|---|---|
| Jp Rainbow Investments Llc | -- | None Available | |
| Patel Jashubhai L | $40,000 | Lawyers Title Company | |
| Patel Jashubhal L | -- | Lawyers Title Company | |
| Jpmorgan Chase Bank National Association | -- | Lawyers Title Company | |
| Washington Mutual Bank | $96,900 | Accommodation | |
| Lopez Juan | $137,000 | Chicago Title Company |
Source: Public Records
Tax History
| Year | Tax Paid | Tax Assessment Tax Assessment Total Assessment is a certain percentage of the fair market value that is determined by local assessors to be the total taxable value of land and additions on the property. | Land | Improvement |
|---|---|---|---|---|
| 2025 | $828 | $51,513 | $6,440 | $45,073 |
| 2024 | $809 | $50,503 | $6,314 | $44,189 |
| 2023 | $788 | $49,513 | $6,190 | $43,323 |
| 2022 | $785 | $48,543 | $6,069 | $42,474 |
| 2021 | $783 | $47,591 | $5,950 | $41,641 |
| 2020 | $780 | $47,103 | $5,889 | $41,214 |
| 2019 | $761 | $46,180 | $5,774 | $40,406 |
| 2018 | $754 | $45,275 | $5,661 | $39,614 |
| 2017 | $732 | $44,387 | $5,550 | $38,837 |
| 2016 | $710 | $43,516 | $5,441 | $38,075 |
| 2015 | $572 | $42,862 | $5,359 | $37,503 |
| 2014 | $556 | $42,022 | $5,254 | $36,768 |
Source: Public Records
Map
Nearby Homes
- 3504 Rainbow Ln
- 3471 20th St
- 1911 Reedy Ave
- 3568 20th St
- 3436 Rainbow Ln
- 2035 Reedy Ave
- 2111 Orange St
- 2208 N Oleander Ct
- 2218 N Cole Ct
- 2221 Baldridge Canyon Ct
- 2226 Cole Ct
- 6786 N Palm Ave
- 2137 Pepper Dr
- 3528 E Aurora Dr
- 3544 E Aurora Dr
- 3505 Orchid Dr E
- 3497 Orchid Dr E
- 3537 E Orchid Dr
- 3553 E Highland Ave
- 27126 Pacific St
- 3506 Rainbow Ln
- 3510 Rainbow Ln
- 3498 Rainbow Ln
- 3518 Rainbow Ln
- 3494 Rainbow Ln
- 3516 Rainbow Ln Unit 1
- 3500 Rainbow Ln
- 3496 Rainbow Ln
- 3520 Rainbow Ln
- 3522 Rainbow Ln Unit 4
- 3505 Rainbow Ln
- 3532 Rainbow Ln
- 3488 Rainbow Ln Unit 3
- 3488 Rainbow Ln
- 3495 Rainbow Ln
- 3530 Rainbow Ln
- 3484 Rainbow Ln
- 3536 Rainbow Ln Unit 4
- 3536 Rainbow Ln Unit 3
- 3490 Rainbow Ln
Your Personal Tour Guide
Ask me questions while you tour the home.