Estimated Value: $490,000 - $527,000
4
Beds
4
Baths
2,016
Sq Ft
$253/Sq Ft
Est. Value
About This Home
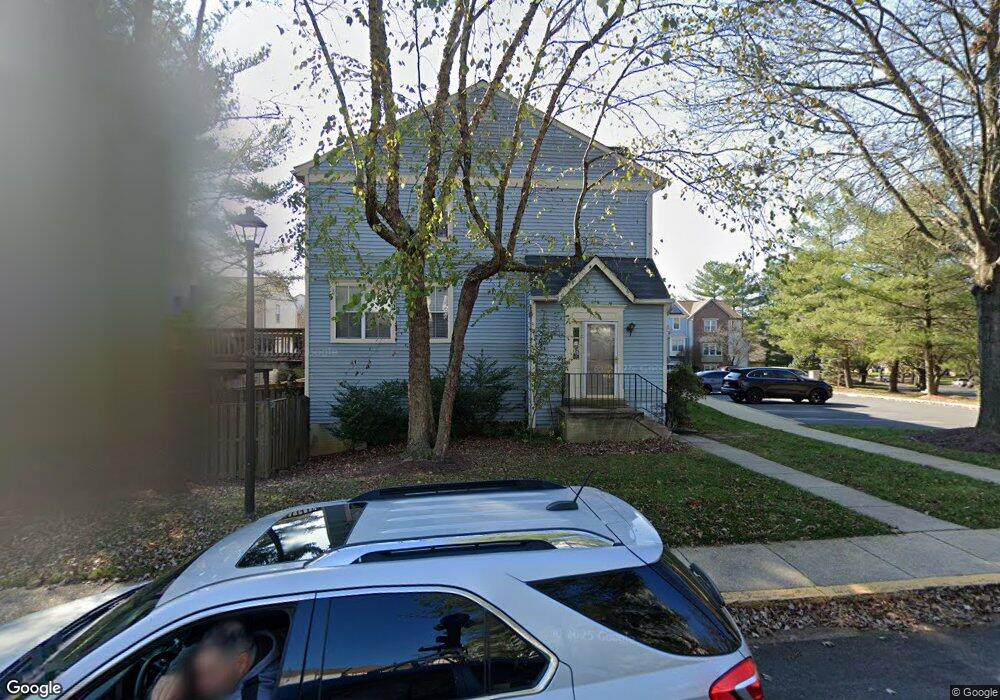
This home is located at 3508 Vintage Spring Terrace, Olney, MD 20832 and is currently estimated at $510,909, approximately $253 per square foot. 3508 Vintage Spring Terrace is a home located in Montgomery County with nearby schools including Olney Elementary School, Rosa M. Parks Middle School, and Sherwood High School.
Ownership History
Date
Name
Owned For
Owner Type
Purchase Details
Closed on
Jun 12, 2019
Sold by
Casey Leslie and Irish Lucas Q
Bought by
Casey Leslie and Casey Caleb
Current Estimated Value
Home Financials for this Owner
Home Financials are based on the most recent Mortgage that was taken out on this home.
Original Mortgage
$282,865
Interest Rate
3.75%
Mortgage Type
FHA
Purchase Details
Closed on
Jul 17, 2009
Sold by
Culling Kathleen
Bought by
Casey Leslie I
Purchase Details
Closed on
Dec 10, 2001
Sold by
Blair Alan P
Bought by
Culling Kathleen
Purchase Details
Closed on
Sep 27, 1995
Sold by
Pakenham Barbara B
Bought by
Blair Alan P
Home Financials for this Owner
Home Financials are based on the most recent Mortgage that was taken out on this home.
Original Mortgage
$149,900
Interest Rate
7.89%
Create a Home Valuation Report for This Property
The Home Valuation Report is an in-depth analysis detailing your home's value as well as a comparison with similar homes in the area
Home Values in the Area
Average Home Value in this Area
Purchase History
| Date | Buyer | Sale Price | Title Company |
|---|---|---|---|
| Casey Leslie | $119,512 | Vantage Point Title Inc | |
| Casey Leslie I | $318,000 | -- | |
| Culling Kathleen | $198,000 | -- | |
| Blair Alan P | $151,600 | -- |
Source: Public Records
Mortgage History
| Date | Status | Borrower | Loan Amount |
|---|---|---|---|
| Previous Owner | Casey Leslie | $282,865 | |
| Previous Owner | Blair Alan P | $149,900 |
Source: Public Records
Tax History Compared to Growth
Tax History
| Year | Tax Paid | Tax Assessment Tax Assessment Total Assessment is a certain percentage of the fair market value that is determined by local assessors to be the total taxable value of land and additions on the property. | Land | Improvement |
|---|---|---|---|---|
| 2025 | $4,872 | $421,300 | $157,500 | $263,800 |
| 2024 | $4,872 | $392,300 | $0 | $0 |
| 2023 | $3,829 | $363,300 | $0 | $0 |
| 2022 | $3,325 | $334,300 | $150,000 | $184,300 |
| 2021 | $3,059 | $325,433 | $0 | $0 |
| 2020 | $3,059 | $316,567 | $0 | $0 |
| 2019 | $2,949 | $307,700 | $150,000 | $157,700 |
| 2018 | $2,839 | $297,967 | $0 | $0 |
| 2017 | $2,790 | $288,233 | $0 | $0 |
| 2016 | $2,496 | $278,500 | $0 | $0 |
| 2015 | $2,496 | $277,500 | $0 | $0 |
| 2014 | $2,496 | $276,500 | $0 | $0 |
Source: Public Records
Map
Nearby Homes
- 18290 Rolling Meadow Way Unit 4
- 3361 Tidewater Ct
- 18026 Ohara Cir
- 18120 Windsor Hill Dr
- 13 Ohara Ct
- 18633 Clovercrest Cir
- 17411 Pipers Way
- 2917 Clovercrest Way
- 2804 Thickett Way
- 18816 Stoneyhurst St
- 4004 Briars Rd
- 3424 Forest Wood Dr
- 0 Briars Rd
- 18816 Alpenglow Ln
- 4201 Briars Rd
- 18200 Littlebrooke Dr
- 18444 Forest Crossing Ct
- 4008 Barnsley Ln
- 18101 Littlebrooke Dr
- 17403 Old Baltimore Rd
- 3510 Vintage Spring Terrace
- 3512 Vintage Spring Terrace
- 3514 Vintage Spring Terrace
- 3504 Vintage Spring Terrace
- 3516 Vintage Spring Terrace
- 3502 Vintage Spring Terrace
- 18121 Homeland Dr
- 3518 Vintage Spring Terrace
- 3500 Vintage Spring Terrace
- 18123 Homeland Dr
- 18020 Vintage River Terrace
- 3507 Vintage Spring Terrace
- 18022 Vintage River Terrace
- 18125 Homeland Dr
- 3505 Vintage Spring Terrace
- 18024 Vintage River Terrace
- 18127 Homeland Dr
- 3503 Vintage Spring Terrace
- 3522 Vintage Spring Terrace
- 3524 Vintage Spring Terrace