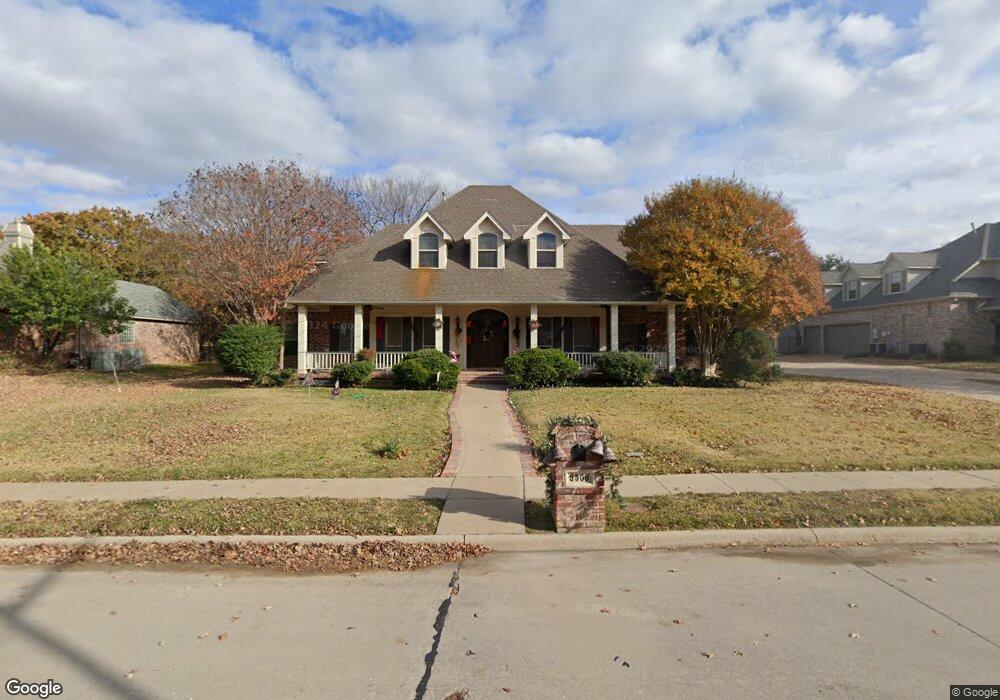
3509 Belmont St Denton, TX 76210
South Denton NeighborhoodEstimated Value: $570,000 - $793,000
4
Beds
4
Baths
3,210
Sq Ft
$207/Sq Ft
Est. Value
About This Home
This home is located at 3509 Belmont St, Denton, TX 76210 and is currently estimated at $663,622, approximately $206 per square foot. 3509 Belmont St is a home located in Denton County with nearby schools including Ryan Elementary School, McMath Middle School, and Denton High School.
Ownership History
Date
Name
Owned For
Owner Type
Purchase Details
Closed on
Jun 30, 1999
Sold by
Kesterson Joseph M and Kesterson Kim
Bought by
Fairley Milton W and Fairley Marie L
Current Estimated Value
Home Financials for this Owner
Home Financials are based on the most recent Mortgage that was taken out on this home.
Original Mortgage
$269,100
Interest Rate
7.21%
Create a Home Valuation Report for This Property
The Home Valuation Report is an in-depth analysis detailing your home's value as well as a comparison with similar homes in the area
Home Values in the Area
Average Home Value in this Area
Purchase History
| Date | Buyer | Sale Price | Title Company |
|---|---|---|---|
| Fairley Milton W | -- | -- |
Source: Public Records
Mortgage History
| Date | Status | Borrower | Loan Amount |
|---|---|---|---|
| Closed | Fairley Milton W | $269,100 |
Source: Public Records
Tax History Compared to Growth
Tax History
| Year | Tax Paid | Tax Assessment Tax Assessment Total Assessment is a certain percentage of the fair market value that is determined by local assessors to be the total taxable value of land and additions on the property. | Land | Improvement |
|---|---|---|---|---|
| 2025 | $4,631 | $640,839 | $176,400 | $511,813 |
| 2024 | $11,245 | $582,581 | $0 | $0 |
| 2023 | $4,641 | $529,619 | $201,600 | $550,361 |
| 2022 | $10,221 | $481,472 | $126,000 | $388,850 |
| 2021 | $9,730 | $450,485 | $100,800 | $349,685 |
| 2020 | $9,095 | $397,911 | $100,800 | $297,111 |
| 2019 | $9,574 | $401,237 | $100,800 | $300,437 |
| 2018 | $9,604 | $397,581 | $100,800 | $296,781 |
| 2017 | $9,489 | $383,895 | $100,800 | $283,095 |
| 2016 | $7,058 | $351,981 | $67,200 | $284,781 |
| 2015 | $6,750 | $336,949 | $67,200 | $272,185 |
| 2013 | -- | $313,416 | $58,800 | $254,616 |
Source: Public Records
Map
Nearby Homes
- 100 Bentwood Ct
- 409 Meadowlands Dr
- 21 Wellington Oaks Cir
- 3309 Del Mar Dr
- 33 Oak Forrest Cir
- 301 Fairmount Ct
- 9 Oak Forrest Cir
- 3200 Belmont St
- 28 Timbergreen Cir
- 9 Royal Oaks Cir
- Type - 2 Plan at Ryan Woods
- 400 Regency Ct
- 3109 Forrestridge Dr
- 3108 Pinehurst Ct
- 39 Highview Cir
- 3916 Maggies Meadow
- 3108 Spenrock Ct
- 4212 Stonetrail Dr
- 3109 Pecan Tree Dr
- 3105 Pecan Tree Dr
- 3513 Belmont St
- 3505 Belmont St
- 3508 Remington St
- 3512 Remington St
- 3504 Remington St
- 3508 Belmont St
- 3512 Belmont St
- 3504 Belmont St
- 3517 Belmont St
- 3501 Belmont St
- 3516 Belmont St
- 3516 Remington St
- 3500 Remington St
- 3500 Belmont St
- 109 Bentwood Ct
- 108 Bentwood Ct
- 3520 Belmont St
- 104 Visalia Ln
- 102 Bentwood Ct
- 115 Visalia Ln