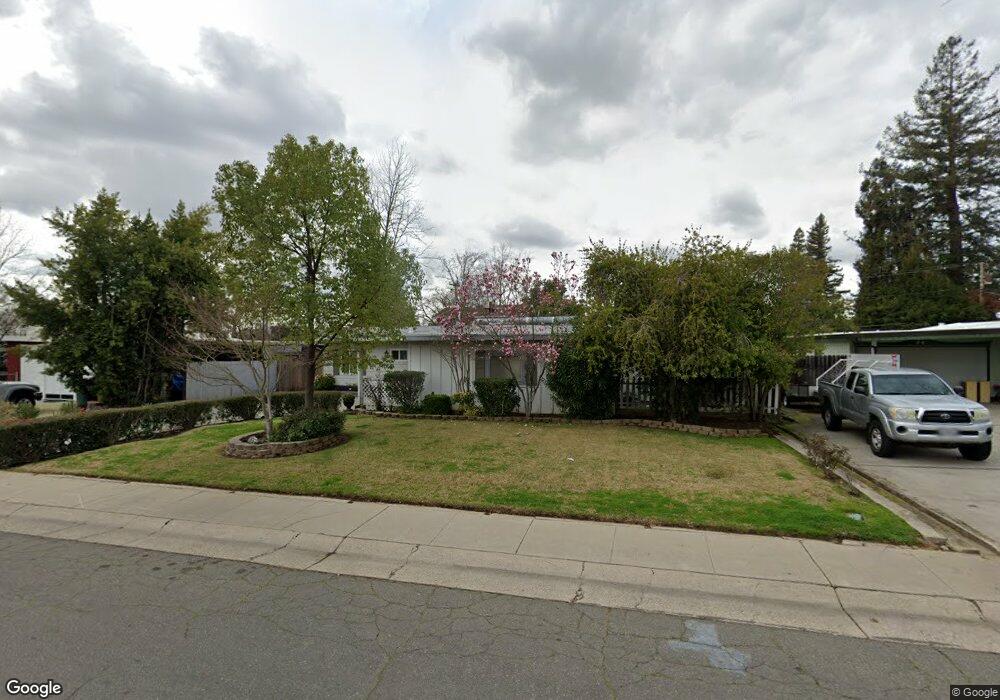
3509 Comstock Way Carmichael, CA 95608
Mission NeighborhoodEstimated Value: $422,322 - $494,000
3
Beds
2
Baths
1,412
Sq Ft
$317/Sq Ft
Est. Value
About This Home
This home is located at 3509 Comstock Way, Carmichael, CA 95608 and is currently estimated at $447,831, approximately $317 per square foot. 3509 Comstock Way is a home located in Sacramento County with nearby schools including Pasadena Avenue Elementary School, Winston Churchill Middle School, and Mira Loma High School.
Ownership History
Date
Name
Owned For
Owner Type
Purchase Details
Closed on
May 5, 2008
Sold by
Marshall Charlotte
Bought by
Charlotte Anne Marshall Revocable Trust
Current Estimated Value
Purchase Details
Closed on
Jul 7, 2000
Sold by
Pittman Leonard and Galati Renee
Bought by
Marshall Charlotte
Home Financials for this Owner
Home Financials are based on the most recent Mortgage that was taken out on this home.
Original Mortgage
$145,030
Outstanding Balance
$52,411
Interest Rate
8.37%
Mortgage Type
FHA
Estimated Equity
$395,420
Purchase Details
Closed on
Jun 20, 2000
Sold by
Bombardier Group and Renee
Bought by
Pittman Leonard and Galati Renee
Home Financials for this Owner
Home Financials are based on the most recent Mortgage that was taken out on this home.
Original Mortgage
$145,030
Outstanding Balance
$52,411
Interest Rate
8.37%
Mortgage Type
FHA
Estimated Equity
$395,420
Create a Home Valuation Report for This Property
The Home Valuation Report is an in-depth analysis detailing your home's value as well as a comparison with similar homes in the area
Home Values in the Area
Average Home Value in this Area
Purchase History
| Date | Buyer | Sale Price | Title Company |
|---|---|---|---|
| Charlotte Anne Marshall Revocable Trust | -- | None Available | |
| Marshall Charlotte | $146,000 | Alliance Title Company | |
| Pittman Leonard | -- | Alliance Title Company |
Source: Public Records
Mortgage History
| Date | Status | Borrower | Loan Amount |
|---|---|---|---|
| Open | Marshall Charlotte | $145,030 |
Source: Public Records
Tax History
| Year | Tax Paid | Tax Assessment Tax Assessment Total Assessment is a certain percentage of the fair market value that is determined by local assessors to be the total taxable value of land and additions on the property. | Land | Improvement |
|---|---|---|---|---|
| 2025 | $6,273 | $219,973 | $60,260 | $159,713 |
| 2024 | $6,273 | $215,661 | $59,079 | $156,582 |
| 2023 | $6,208 | $211,433 | $57,921 | $153,512 |
| 2022 | $6,181 | $207,288 | $56,786 | $150,502 |
| 2021 | $6,139 | $203,224 | $55,673 | $147,551 |
| 2020 | $6,093 | $201,142 | $55,103 | $146,039 |
| 2019 | $2,352 | $197,199 | $54,023 | $143,176 |
| 2018 | $2,323 | $193,333 | $52,964 | $140,369 |
| 2017 | $2,300 | $189,543 | $51,926 | $137,617 |
| 2016 | $2,149 | $185,827 | $50,908 | $134,919 |
| 2015 | $2,110 | $183,037 | $50,144 | $132,893 |
| 2014 | $2,064 | $179,452 | $49,162 | $130,290 |
Source: Public Records
Map
Nearby Homes
- 4740 Whitney Ave
- 5151 Janell Way
- 3430 Nadine St
- 5113 Walnut Garden Ct
- 4512 Woodson Ave
- 3431 Hunter Ln
- 3204 Mapes Ct
- 4951 Kurz Cir
- 5307 Nyoda Way
- 3041 Root Ave
- 3329 Jayanne Way
- 5213 Gibbons Dr
- 4838 Robertson Ave
- 4601 Gibbons Dr
- 3332 Jayanne Way
- 4720 Robertson Ave
- 3923 Oak Villa Cir
- 3312 Jayanne Way
- 4941 Wendy Ct
- 4007 Oak Villa Cir
- 3505 Comstock Way
- 3513 Comstock Way
- 3512 Condor Ct
- 3508 Condor Ct
- 3517 Comstock Way
- 3501 Comstock Way
- 3504 Condor Ct
- 3500 Winston Way
- 3506 Comstock Way
- 3516 Condor Ct
- 4911 Whitney Ave
- 3500 Condor Ct
- 3521 Comstock Way
- 4840 Zube Ct
- 3504 Winston Way
- 3504 Winston Way
- 3520 Comstock Way
- 3520 Condor Ct
- 4915 Whitney Ave
- 3509 Condor Ct
Your Personal Tour Guide
Ask me questions while you tour the home.