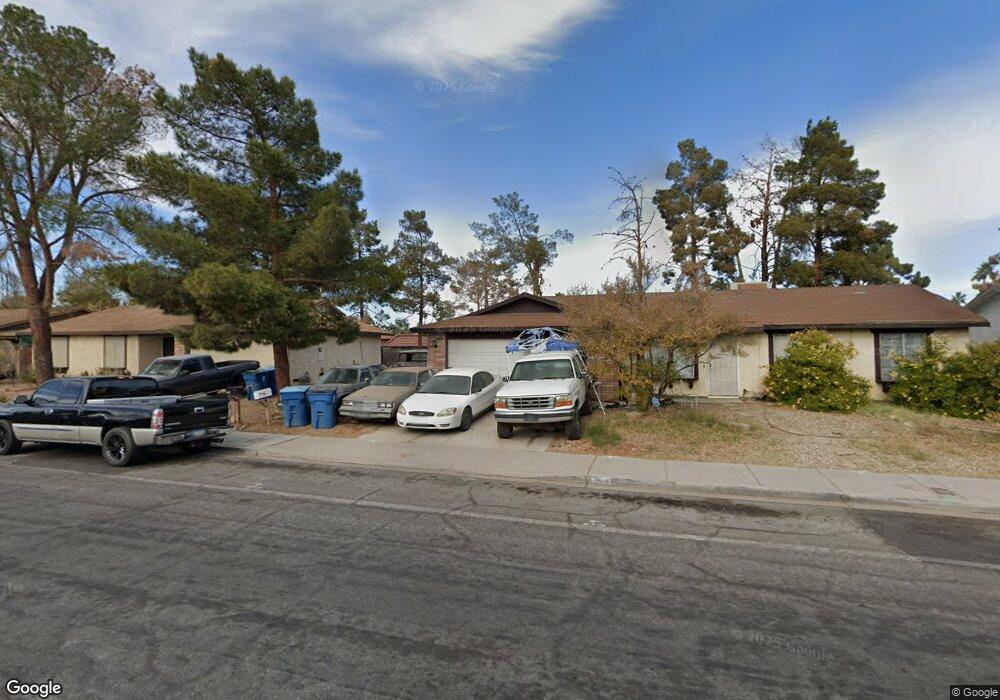
3509 Folage Dr Unit 4 Las Vegas, NV 89110
East Las Vegas NeighborhoodEstimated Value: $192,000 - $223,000
2
Beds
2
Baths
1,022
Sq Ft
$204/Sq Ft
Est. Value
About This Home
This home is located at 3509 Folage Dr Unit 4, Las Vegas, NV 89110 and is currently estimated at $208,225, approximately $203 per square foot. 3509 Folage Dr Unit 4 is a home located in Clark County with nearby schools including Arturo Cambeiro Elementary School, J.D. Smith Middle School, and Desert Pines High School.
Ownership History
Date
Name
Owned For
Owner Type
Purchase Details
Closed on
May 31, 2011
Sold by
Barnes Patricia D
Bought by
Barnes Patricia D and Barnes Daryl A
Current Estimated Value
Purchase Details
Closed on
Jul 11, 2001
Sold by
Rojo Vidal
Bought by
Barnes Patricia D
Home Financials for this Owner
Home Financials are based on the most recent Mortgage that was taken out on this home.
Original Mortgage
$64,920
Outstanding Balance
$25,146
Interest Rate
7.21%
Mortgage Type
FHA
Estimated Equity
$183,079
Purchase Details
Closed on
Aug 5, 1997
Sold by
Allen Elaine
Bought by
Rojo Vidal
Home Financials for this Owner
Home Financials are based on the most recent Mortgage that was taken out on this home.
Original Mortgage
$54,250
Interest Rate
7.42%
Mortgage Type
FHA
Purchase Details
Closed on
May 16, 1995
Sold by
Houlf Dawn Lynn
Bought by
Allen Elaine
Home Financials for this Owner
Home Financials are based on the most recent Mortgage that was taken out on this home.
Original Mortgage
$41,500
Interest Rate
8.47%
Create a Home Valuation Report for This Property
The Home Valuation Report is an in-depth analysis detailing your home's value as well as a comparison with similar homes in the area
Home Values in the Area
Average Home Value in this Area
Purchase History
| Date | Buyer | Sale Price | Title Company |
|---|---|---|---|
| Barnes Patricia D | -- | None Available | |
| Barnes Patricia D | $65,500 | United Title | |
| Rojo Vidal | $54,500 | Land Title | |
| Allen Elaine | $52,000 | Stewart Title |
Source: Public Records
Mortgage History
| Date | Status | Borrower | Loan Amount |
|---|---|---|---|
| Open | Barnes Patricia D | $64,920 | |
| Previous Owner | Rojo Vidal | $54,250 | |
| Previous Owner | Allen Elaine | $41,500 |
Source: Public Records
Tax History Compared to Growth
Tax History
| Year | Tax Paid | Tax Assessment Tax Assessment Total Assessment is a certain percentage of the fair market value that is determined by local assessors to be the total taxable value of land and additions on the property. | Land | Improvement |
|---|---|---|---|---|
| 2025 | $383 | $31,193 | $12,950 | $18,243 |
| 2024 | $372 | $31,193 | $12,950 | $18,243 |
| 2023 | $372 | $33,778 | $16,450 | $17,328 |
| 2022 | $362 | $29,366 | $12,600 | $16,766 |
| 2021 | $351 | $25,660 | $11,900 | $13,760 |
| 2020 | $338 | $27,233 | $12,600 | $14,633 |
| 2019 | $328 | $22,432 | $7,700 | $14,732 |
| 2018 | $319 | $18,850 | $4,550 | $14,300 |
| 2017 | $555 | $16,938 | $4,200 | $12,738 |
| 2016 | $303 | $18,270 | $3,150 | $15,120 |
| 2015 | $301 | $13,169 | $2,800 | $10,369 |
| 2014 | $292 | $11,729 | $1,925 | $9,804 |
Source: Public Records
Map
Nearby Homes
- 833 Hedge Way Unit 2
- 833 Hedge Way Unit 6
- 3620 Park Oliver Dr
- 3601 Valley Forge Ave
- 1025 Dumbarton St
- 3624 Chevy Chase Ave
- 3601 Chevy Chase Ave
- 3933 Harris Ave
- 1001 Declaration Dr
- 3320 Osage Ave
- 1201 Parliament Place
- 653 Lineshack Ln
- 1405 N Sandhill Rd Unit 2
- 3212 Osage Ave
- 3204 Osage Ave
- 1417 Virgil St
- 3205 Mary Ann Ave
- 3917 Alou Dr
- 745 Taft Ct
- 432 Anchor St
- 3509 Folage Dr Unit 3
- 3509 Folage Dr Unit 2
- 3509 Folage Dr Unit 1
- 3508 Harris Ave
- 3512 Harris Ave
- 3501 Folage Dr Unit 4
- 3501 Folage Dr Unit 6
- 3501 Folage Dr Unit 7
- 3501 Folage Dr Unit 5
- 3501 Folage Dr Unit 3
- 3501 Folage Dr Unit 1
- 3501 Folage Dr Unit 8
- 3501 Folage Dr Unit 2
- 3504 Harris Ave
- 3516 Harris Ave
- 809 Hedge Way Unit 2
- 809 Hedge Way Unit 8
- 809 Hedge Way Unit 7
- 809 Hedge Way Unit 1
- 809 Hedge Way Unit 5