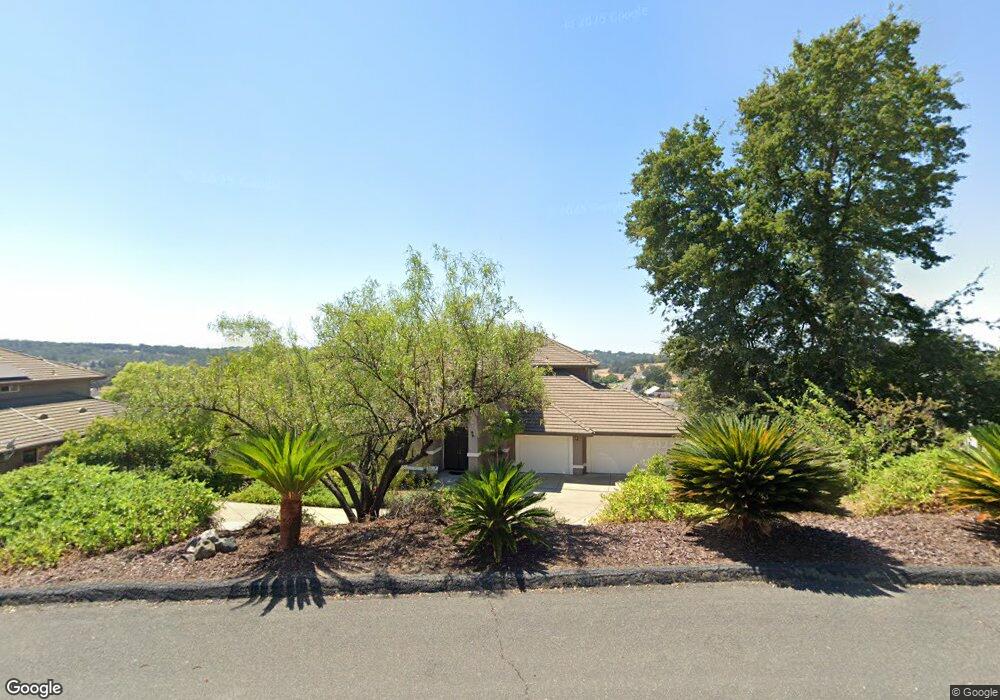
3509 Foxmore Ln Rescue, CA 95672
Estimated Value: $693,000 - $959,968
5
Beds
3
Baths
3,570
Sq Ft
$240/Sq Ft
Est. Value
About This Home
This home is located at 3509 Foxmore Ln, Rescue, CA 95672 and is currently estimated at $857,492, approximately $240 per square foot. 3509 Foxmore Ln is a home located in El Dorado County with nearby schools including Green Valley Elementary School, Pleasant Grove Middle School, and Ponderosa High School.
Ownership History
Date
Name
Owned For
Owner Type
Purchase Details
Closed on
Feb 24, 2009
Sold by
Nationstar Mortgage Llc
Bought by
Gomez Lisa and Gomez Jorge
Current Estimated Value
Home Financials for this Owner
Home Financials are based on the most recent Mortgage that was taken out on this home.
Original Mortgage
$375,050
Interest Rate
5.17%
Mortgage Type
FHA
Purchase Details
Closed on
Mar 13, 2008
Sold by
Morsey Thomas M and Morsey Kerry L
Bought by
Nationstar Mortgage Llc
Purchase Details
Closed on
Dec 22, 2004
Sold by
Lafferty Homes At Sierra Crossing
Bought by
Morsey Thomas M and Morsey Kerry L
Home Financials for this Owner
Home Financials are based on the most recent Mortgage that was taken out on this home.
Original Mortgage
$494,384
Interest Rate
5.99%
Mortgage Type
Purchase Money Mortgage
Create a Home Valuation Report for This Property
The Home Valuation Report is an in-depth analysis detailing your home's value as well as a comparison with similar homes in the area
Home Values in the Area
Average Home Value in this Area
Purchase History
| Date | Buyer | Sale Price | Title Company |
|---|---|---|---|
| Gomez Lisa | $388,000 | First American Title Ins Co | |
| Nationstar Mortgage Llc | $562,500 | Accommodation | |
| Morsey Thomas M | $618,000 | First American Title Co |
Source: Public Records
Mortgage History
| Date | Status | Borrower | Loan Amount |
|---|---|---|---|
| Previous Owner | Gomez Lisa | $375,050 | |
| Previous Owner | Morsey Thomas M | $494,384 | |
| Closed | Morsey Thomas M | $123,596 |
Source: Public Records
Tax History
| Year | Tax Paid | Tax Assessment Tax Assessment Total Assessment is a certain percentage of the fair market value that is determined by local assessors to be the total taxable value of land and additions on the property. | Land | Improvement |
|---|---|---|---|---|
| 2025 | $5,835 | $532,443 | $93,994 | $438,449 |
| 2024 | $5,835 | $522,003 | $92,151 | $429,852 |
| 2023 | $5,728 | $511,769 | $90,345 | $421,424 |
| 2022 | $5,651 | $501,735 | $88,574 | $413,161 |
| 2021 | $5,580 | $491,898 | $86,838 | $405,060 |
| 2020 | $5,187 | $456,855 | $85,948 | $370,907 |
| 2019 | $5,105 | $447,898 | $84,263 | $363,635 |
| 2018 | $4,954 | $439,116 | $82,611 | $356,505 |
| 2017 | $4,878 | $430,507 | $80,992 | $349,515 |
| 2016 | $4,811 | $422,066 | $79,404 | $342,662 |
| 2015 | $4,733 | $415,728 | $78,212 | $337,516 |
| 2014 | $4,652 | $407,586 | $76,681 | $330,905 |
Source: Public Records
Map
Nearby Homes
- 3497 Lambeth Dr
- 7440 Aster Ln
- 7400 Aster Ln
- 7405 Aster Ln
- 7330 Aster Ln
- 7467 Aster Ln
- 6940 Daffodil Trail
- 2512 Bass Lake Rd
- 6981 Daffodil Trail
- The El Dorado Plan at Oakhaven
- The Reserve Plan at Oakhaven
- 6971 Daffodil Trail
- 2435 Sandpiper Way
- 2836 Clemson Dr
- 3281 La Canada Dr
- 1900 Deer Valley Rd
- 511 Renaissance Place
- 3363 Cimmarron Rd
- 2628 Royal Park Dr
- 353 El Greco Ct
- 3503 Foxmore Ln
- 3515 Foxmore Ln
- 5011 Pryor Dr
- 5021 Pryor Dr
- 3497 Foxmore Ln
- 3510 Foxmore Ln
- 5005 Pryor Dr
- 5027 Pryor Dr
- 3502 Foxmore Ln
- 3526 Foxmore Ln
- 5001 Pryor Dr
- 3489 Foxmore Ln
- 5035 Pryor Dr
- 3494 Foxmore Ln Unit 2
- 3529 Foxmore Ln
- 5016 Pryor Dr
- 5022 Pryor Dr
- 5008 Pryor Dr
- 5000 Pryor Dr
- 3120 Weymouth Way
Your Personal Tour Guide
Ask me questions while you tour the home.