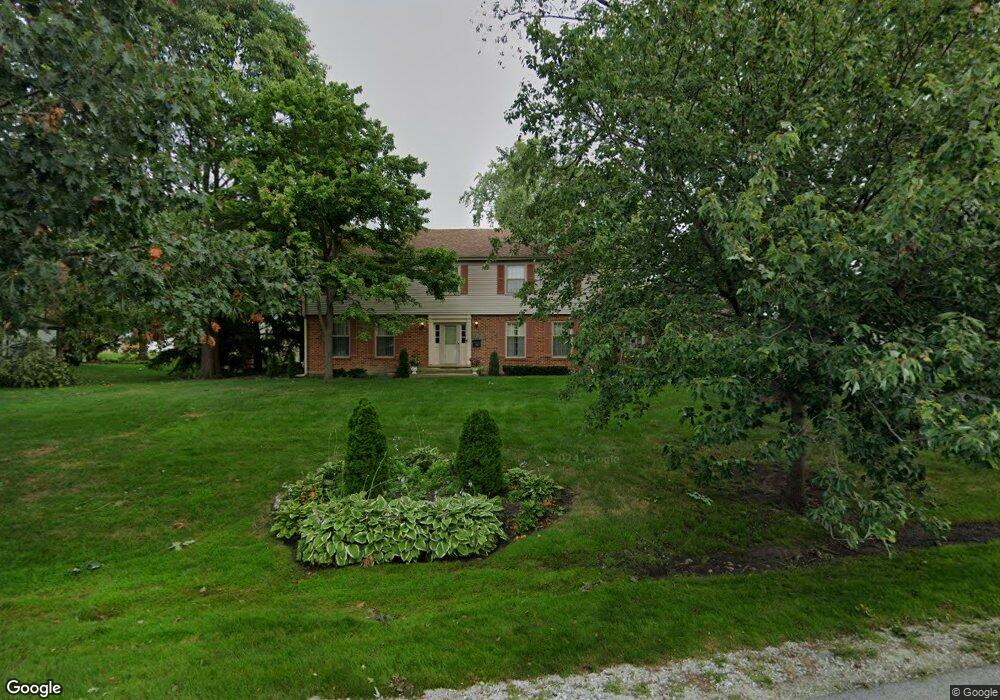
3509 Ionia Ave Olympia Fields, IL 60461
Estimated Value: $327,351 - $379,000
4
Beds
3
Baths
2,566
Sq Ft
$140/Sq Ft
Est. Value
About This Home
This home is located at 3509 Ionia Ave, Olympia Fields, IL 60461 and is currently estimated at $360,088, approximately $140 per square foot. 3509 Ionia Ave is a home located in Cook County with nearby schools including Illinois School, Arcadia Elementary School, and Indiana Elementary School.
Ownership History
Date
Name
Owned For
Owner Type
Purchase Details
Closed on
Aug 25, 2003
Sold by
Hawthorne Sonya and Hawthorne Marcus
Bought by
White Charles A and White Arlene F
Current Estimated Value
Home Financials for this Owner
Home Financials are based on the most recent Mortgage that was taken out on this home.
Original Mortgage
$178,640
Outstanding Balance
$79,841
Interest Rate
6.18%
Mortgage Type
FHA
Estimated Equity
$280,247
Purchase Details
Closed on
Dec 28, 1998
Sold by
Associates Relocation Management Co Inc
Bought by
Hawthorne Marcus and Hawthorne Sonya
Home Financials for this Owner
Home Financials are based on the most recent Mortgage that was taken out on this home.
Original Mortgage
$177,650
Interest Rate
6.75%
Purchase Details
Closed on
Jul 30, 1998
Sold by
Prewitt Keith and Prewitt Pamela
Bought by
Associates Relocation Management Co Inc
Create a Home Valuation Report for This Property
The Home Valuation Report is an in-depth analysis detailing your home's value as well as a comparison with similar homes in the area
Home Values in the Area
Average Home Value in this Area
Purchase History
| Date | Buyer | Sale Price | Title Company |
|---|---|---|---|
| White Charles A | -- | First American Title | |
| Hawthorne Marcus | $187,000 | -- | |
| Associates Relocation Management Co Inc | $194,500 | -- |
Source: Public Records
Mortgage History
| Date | Status | Borrower | Loan Amount |
|---|---|---|---|
| Open | White Charles A | $178,640 | |
| Previous Owner | Hawthorne Marcus | $177,650 |
Source: Public Records
Tax History
| Year | Tax Paid | Tax Assessment Tax Assessment Total Assessment is a certain percentage of the fair market value that is determined by local assessors to be the total taxable value of land and additions on the property. | Land | Improvement |
|---|---|---|---|---|
| 2025 | $11,612 | $30,001 | $6,588 | $23,413 |
| 2024 | $11,612 | $30,001 | $6,588 | $23,413 |
| 2023 | $10,950 | $30,001 | $6,588 | $23,413 |
| 2022 | $10,950 | $22,702 | $5,813 | $16,889 |
| 2021 | $10,917 | $22,701 | $5,812 | $16,889 |
| 2020 | $10,096 | $22,701 | $5,812 | $16,889 |
| 2019 | $9,140 | $20,871 | $5,425 | $15,446 |
| 2018 | $9,072 | $20,871 | $5,425 | $15,446 |
| 2017 | $8,801 | $20,871 | $5,425 | $15,446 |
| 2016 | $8,941 | $20,302 | $5,037 | $15,265 |
| 2015 | $8,849 | $20,302 | $5,037 | $15,265 |
| 2014 | $8,676 | $20,302 | $5,037 | $15,265 |
| 2013 | $9,061 | $22,931 | $5,037 | $17,894 |
Source: Public Records
Map
Nearby Homes
- 20436 Arcadian Dr
- 20415 Doria Ln
- 20535 Marathon Ct
- 3506 Ithaca Rd
- 3451 Ithaca Rd
- 20601 Parthenon Way
- 20920 Governors Hwy
- 831 Violet Ln
- 20001 Arquilla Cir
- 2935 Dartmouth Ln
- 2925 Dartmouth Ln
- 4141 204th St
- 3415 Vollmer Rd Unit 308
- 21142 Locust St
- 3507 Park Place
- 4110 Applewood Ln
- 3427 Vollmer Rd Unit 205
- 3427 Vollmer Rd Unit 202
- 3427 Vollmer Rd Unit 209
- 20015 Delphi Dr
- 3501 Ionia Ave
- 20455 Arcadian Dr
- 20463 Arcadian Dr
- 20449 Arcadian Ct
- 3506 Ionia Ave
- 20445 Arcadian Ct
- 3441 Ionia Ave
- 3448 Ionia Ave
- 20460 Arcadian Dr
- 20468 Arcadian Dr
- 20452 Arcadian Dr
- 3440 Ionia Ave
- 20441 Arcadian Ct
- 20444 Arcadian Dr
- 3432 Ionia Ave
- 3543 Ionia Ave
- 20437 Arcadian Ct
- 20429 Arcadian Ct
- 20447 Doria Ln
- 3542 Ionia Ave
Your Personal Tour Guide
Ask me questions while you tour the home.