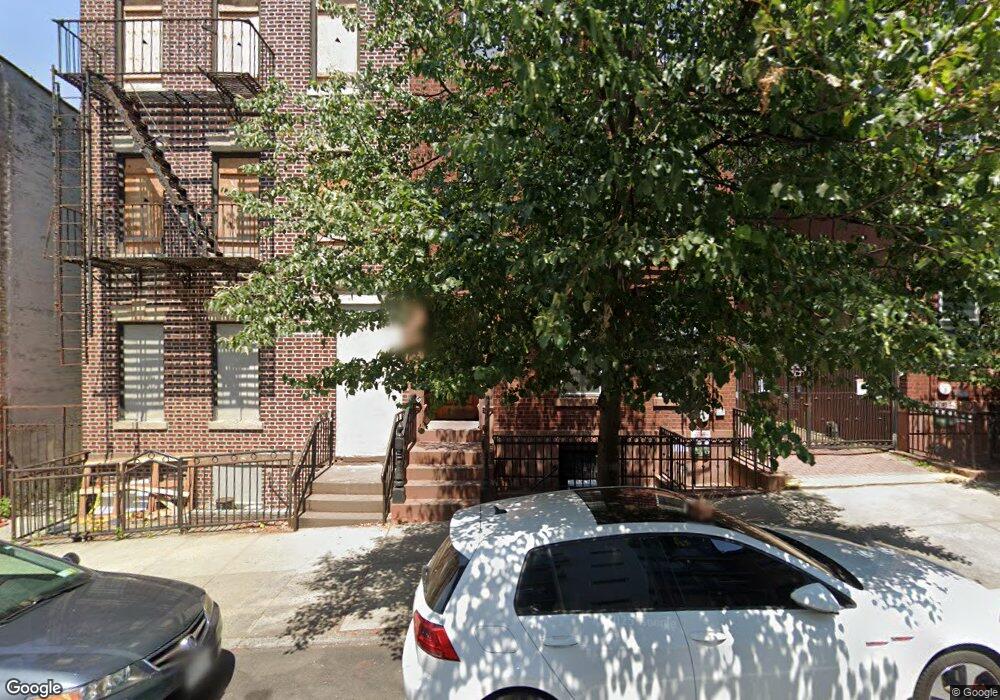
351 21st St Unit 1F353 Brooklyn, NY 11215
South Slope NeighborhoodEstimated Value: $710,000 - $1,098,000
--
Bed
--
Bath
995
Sq Ft
$894/Sq Ft
Est. Value
About This Home
This home is located at 351 21st St Unit 1F353, Brooklyn, NY 11215 and is currently estimated at $889,248, approximately $893 per square foot. 351 21st St Unit 1F353 is a home located in Kings County with nearby schools including Magnet School of Math Science & Design Technology, New Visions Aim Charter High School I., and A. Fantis School of Saints Constantine and Helen Cathedral.
Ownership History
Date
Name
Owned For
Owner Type
Purchase Details
Closed on
Mar 22, 2019
Sold by
Amanda Mount As Executrix and Last Will And Testament Of Satadru Sen
Bought by
Torres Colleen C and Torres Frederick C
Current Estimated Value
Home Financials for this Owner
Home Financials are based on the most recent Mortgage that was taken out on this home.
Original Mortgage
$522,000
Outstanding Balance
$456,105
Interest Rate
4.3%
Mortgage Type
New Conventional
Estimated Equity
$433,144
Purchase Details
Closed on
Apr 12, 2007
Sold by
351-353 21St Street Realty Llc
Bought by
Mount Amanda and Sen Satadru
Create a Home Valuation Report for This Property
The Home Valuation Report is an in-depth analysis detailing your home's value as well as a comparison with similar homes in the area
Home Values in the Area
Average Home Value in this Area
Purchase History
| Date | Buyer | Sale Price | Title Company |
|---|---|---|---|
| Torres Colleen C | $580,000 | -- | |
| Torres Colleen C | $580,000 | -- | |
| Torres Colleen C | $580,000 | -- | |
| Torres Colleen C | $580,000 | -- | |
| Torres Colleen C | $580,000 | -- | |
| Torres Colleen C | $580,000 | -- | |
| Mount Amanda | $375,000 | -- | |
| Mount Amanda | $375,000 | -- | |
| Mount Amanda | $375,000 | -- | |
| Mount Amanda | $375,000 | -- |
Source: Public Records
Mortgage History
| Date | Status | Borrower | Loan Amount |
|---|---|---|---|
| Open | Torres Colleen C | $522,000 | |
| Closed | Torres Colleen C | $522,000 |
Source: Public Records
Tax History Compared to Growth
Tax History
| Year | Tax Paid | Tax Assessment Tax Assessment Total Assessment is a certain percentage of the fair market value that is determined by local assessors to be the total taxable value of land and additions on the property. | Land | Improvement |
|---|---|---|---|---|
| 2025 | $6,251 | $52,504 | $5,260 | $47,244 |
| 2024 | $6,251 | $51,548 | $5,260 | $46,288 |
| 2023 | $6,062 | $51,210 | $5,260 | $45,950 |
| 2022 | $5,907 | $49,362 | $5,260 | $44,102 |
| 2021 | $5,628 | $45,880 | $5,260 | $40,620 |
| 2020 | $2,530 | $48,623 | $5,260 | $43,363 |
| 2019 | $4,336 | $48,623 | $5,260 | $43,363 |
| 2016 | $4,370 | $42,644 | $5,260 | $37,384 |
| 2015 | $1,556 | $42,829 | $5,260 | $37,569 |
| 2014 | $1,556 | $34,084 | $5,260 | $28,824 |
Source: Public Records
Map
Nearby Homes
- 344 21st St
- 335 21st St
- 353 20th St Unit 3
- 353 20th St Unit 2
- 353 20th St Unit PH
- 353 20th St Unit TH
- 353 20th St Unit 4
- 325A 22nd St
- 334 22nd St Unit 3B
- 324 20th St Unit 2E
- 318 21st St
- 321 22nd St
- 695 6th Ave Unit 2-A
- 695 6th Ave Unit 2B
- 308 23rd St
- 719 6th Ave Unit 1
- 300 20th St
- 290 19th St
- 282 21st St Unit 2C
- 1918 8th Ave
- 351 21st St Unit 4R353
- 351 21st St Unit 4F353
- 351 21st St Unit 3R353
- 351 21st St Unit 3F353
- 351 21st St Unit 2R353
- 351 21st St Unit 1R353
- 351 21st St Unit 4R
- 351 21st St Unit 4F
- 351 21st St Unit 3R
- 351 21st St Unit 3F
- 351 21st St Unit 2R
- 351 21st St Unit 2F
- 351 21st St Unit 1R
- 351-353 21st St Unit 1R
- 351-353 21st St Unit 3F
- 351-353 21st St Unit 2R
- 351 21st St Unit PS1
- 351 21st St Unit PS6