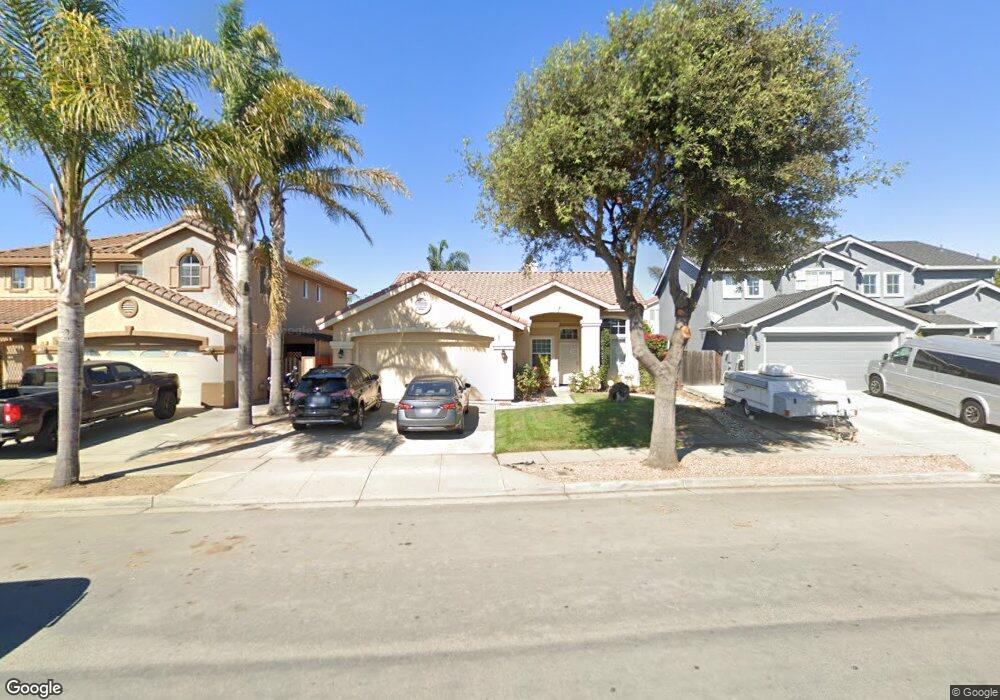
351 Chardonnay Dr Salinas, CA 93906
Harden Ranch NeighborhoodEstimated Value: $738,403 - $836,000
3
Beds
2
Baths
1,510
Sq Ft
$528/Sq Ft
Est. Value
About This Home
This home is located at 351 Chardonnay Dr, Salinas, CA 93906 and is currently estimated at $797,351, approximately $528 per square foot. 351 Chardonnay Dr is a home located in Monterey County with nearby schools including North Salinas High School.
Ownership History
Date
Name
Owned For
Owner Type
Purchase Details
Closed on
Dec 25, 2021
Sold by
Munoz Dionicio C and Munoz Hilda C
Bought by
Munoz Dionicio C and Munoz Hilda G
Current Estimated Value
Purchase Details
Closed on
Aug 10, 2000
Sold by
Wilson Clyde J and Wilson Un Hui Larid
Bought by
Munoz Dionicio C and Munoz Hilda G
Home Financials for this Owner
Home Financials are based on the most recent Mortgage that was taken out on this home.
Original Mortgage
$191,000
Outstanding Balance
$68,717
Interest Rate
8.11%
Estimated Equity
$728,634
Purchase Details
Closed on
Nov 29, 1998
Sold by
Kaufman & Broad Monterey Bay Inc
Bought by
Yee Deborah J
Home Financials for this Owner
Home Financials are based on the most recent Mortgage that was taken out on this home.
Original Mortgage
$226,800
Interest Rate
6.84%
Purchase Details
Closed on
Dec 3, 1997
Sold by
North Salinas Partners Llc
Bought by
Wilson Clyde J and Wilson Un Hui Laird
Create a Home Valuation Report for This Property
The Home Valuation Report is an in-depth analysis detailing your home's value as well as a comparison with similar homes in the area
Home Values in the Area
Average Home Value in this Area
Purchase History
| Date | Buyer | Sale Price | Title Company |
|---|---|---|---|
| Munoz Dionicio C | -- | None Available | |
| Munoz Dionicio C | $281,000 | Stewart Title | |
| Yee Deborah J | $252,000 | First American Title Co | |
| Wilson Clyde J | $185,500 | Stewart Title |
Source: Public Records
Mortgage History
| Date | Status | Borrower | Loan Amount |
|---|---|---|---|
| Open | Munoz Dionicio C | $191,000 | |
| Previous Owner | Yee Deborah J | $226,800 |
Source: Public Records
Tax History
| Year | Tax Paid | Tax Assessment Tax Assessment Total Assessment is a certain percentage of the fair market value that is determined by local assessors to be the total taxable value of land and additions on the property. | Land | Improvement |
|---|---|---|---|---|
| 2025 | $4,979 | $423,419 | $150,681 | $272,738 |
| 2024 | $4,979 | $415,118 | $147,727 | $267,391 |
| 2023 | $4,592 | $406,980 | $144,831 | $262,149 |
| 2022 | $4,546 | $399,001 | $141,992 | $257,009 |
| 2021 | $4,467 | $391,178 | $139,208 | $251,970 |
| 2020 | $4,271 | $387,168 | $137,781 | $249,387 |
| 2019 | $4,144 | $379,578 | $135,080 | $244,498 |
| 2018 | $4,266 | $372,136 | $132,432 | $239,704 |
| 2017 | $4,309 | $364,840 | $129,836 | $235,004 |
| 2016 | $4,180 | $357,688 | $127,291 | $230,397 |
| 2015 | $4,144 | $352,316 | $125,379 | $226,937 |
| 2014 | $3,970 | $345,415 | $122,923 | $222,492 |
Source: Public Records
Map
Nearby Homes
- 327 Rhine Ct
- 1823 Broadway Dr
- 1829 Delancey Dr
- 1838 Lancashire Dr
- 1667 Klamath Dr
- 607 Calaveras Dr
- 55 San Juan Grade Rd Unit 18
- 55 San Juan Grade Rd Unit 63
- 1443 Parsons Ave
- 1445 Amador Cir
- 1780 Truckee Way
- 634 Yreka Dr
- 1421 Amador Cir
- 336 Rainier Dr
- 730 N Main St
- 323 Chaparral St
- 383 Natividad Rd
- 18732 Coolidge St
- 728 Saratoga Dr Unit 1
- 1527 Atherton Way
- 349 Chardonnay Dr
- 353 Chardonnay Dr
- 334 Riesling Way
- 336 Riesling Way
- 347 Chardonnay Dr
- 338 Riesling Way
- 332 Riesling Way
- 345 Chardonnay Dr
- 330 Riesling Way
- 350 Chardonnay Dr
- 352 Chardonnay Dr
- 348 Chardonnay Dr
- 357 Chardonnay Dr
- 354 Chardonnay Dr
- 328 Riesling Way
- 343 Chardonnay Dr
- 1908 Burgundy Way
- 346 Chardonnay Dr
- 356 Chardonnay Dr
- 326 Riesling Way
Your Personal Tour Guide
Ask me questions while you tour the home.