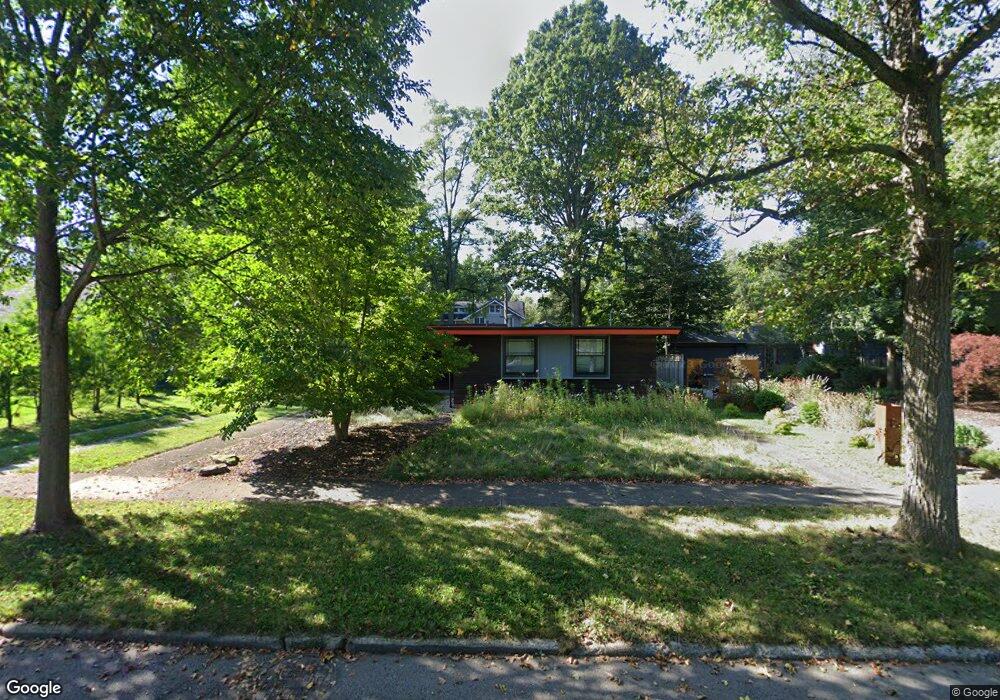
351 Elm St Oberlin, OH 44074
Estimated Value: $212,595 - $306,000
3
Beds
1
Bath
1,380
Sq Ft
$197/Sq Ft
Est. Value
About This Home
This home is located at 351 Elm St, Oberlin, OH 44074 and is currently estimated at $271,899, approximately $197 per square foot. 351 Elm St is a home located in Lorain County with nearby schools including Oberlin Elementary School, Prospect Elementary School, and Langston Middle School.
Ownership History
Date
Name
Owned For
Owner Type
Purchase Details
Closed on
Apr 23, 2007
Sold by
Nelson Andrew P
Bought by
Woods Kevin M and Roles Angela J
Current Estimated Value
Home Financials for this Owner
Home Financials are based on the most recent Mortgage that was taken out on this home.
Original Mortgage
$134,400
Outstanding Balance
$81,396
Interest Rate
6.18%
Mortgage Type
Purchase Money Mortgage
Estimated Equity
$190,503
Purchase Details
Closed on
Feb 26, 2005
Sold by
Leary Margaret A
Bought by
Nelson Andrew P
Home Financials for this Owner
Home Financials are based on the most recent Mortgage that was taken out on this home.
Original Mortgage
$116,000
Interest Rate
5.67%
Mortgage Type
Purchase Money Mortgage
Purchase Details
Closed on
Mar 28, 2000
Sold by
Roellinger Harriet F
Bought by
Leary Margaret A and Harriet E Roellinger Intervivos Trust #1
Create a Home Valuation Report for This Property
The Home Valuation Report is an in-depth analysis detailing your home's value as well as a comparison with similar homes in the area
Home Values in the Area
Average Home Value in this Area
Purchase History
| Date | Buyer | Sale Price | Title Company |
|---|---|---|---|
| Woods Kevin M | $168,000 | Real Estate Title | |
| Nelson Andrew P | $125,000 | Real Estate Title | |
| Leary Margaret A | -- | -- |
Source: Public Records
Mortgage History
| Date | Status | Borrower | Loan Amount |
|---|---|---|---|
| Open | Woods Kevin M | $134,400 | |
| Closed | Nelson Andrew P | $116,000 |
Source: Public Records
Tax History
| Year | Tax Paid | Tax Assessment Tax Assessment Total Assessment is a certain percentage of the fair market value that is determined by local assessors to be the total taxable value of land and additions on the property. | Land | Improvement |
|---|---|---|---|---|
| 2024 | $2,681 | $53,879 | $16,205 | $37,674 |
| 2023 | $2,453 | $44,268 | $12,838 | $31,430 |
| 2022 | $2,388 | $44,268 | $12,838 | $31,430 |
| 2021 | $2,382 | $44,268 | $12,838 | $31,430 |
| 2020 | $2,219 | $38,800 | $11,250 | $27,550 |
| 2019 | $2,189 | $38,800 | $11,250 | $27,550 |
| 2018 | $2,087 | $38,800 | $11,250 | $27,550 |
| 2017 | $1,970 | $35,890 | $7,270 | $28,620 |
| 2016 | $1,990 | $35,890 | $7,270 | $28,620 |
| 2015 | $1,992 | $35,890 | $7,270 | $28,620 |
| 2014 | $1,926 | $33,860 | $6,860 | $27,000 |
| 2013 | $1,893 | $33,860 | $6,860 | $27,000 |
Source: Public Records
Map
Nearby Homes
- 62 N Prospect St
- 252 W College St
- 215 W College St
- 149 Morgan St
- 147 Morgan St
- 603 Beech St
- 121 S Professor St
- 123 S Professor St
- 89 S Professor St
- 246 W Hamilton St
- 32 W Lincoln St
- 27 Union St
- 0 S Park St
- 345 N Professor St
- 258 N Pleasant St
- VL E Hamilton St
- 168 E Hamilton St
- 182 E Hamilton St
- 14409 State Route 58
- 396 Reserve Ave
Your Personal Tour Guide
Ask me questions while you tour the home.