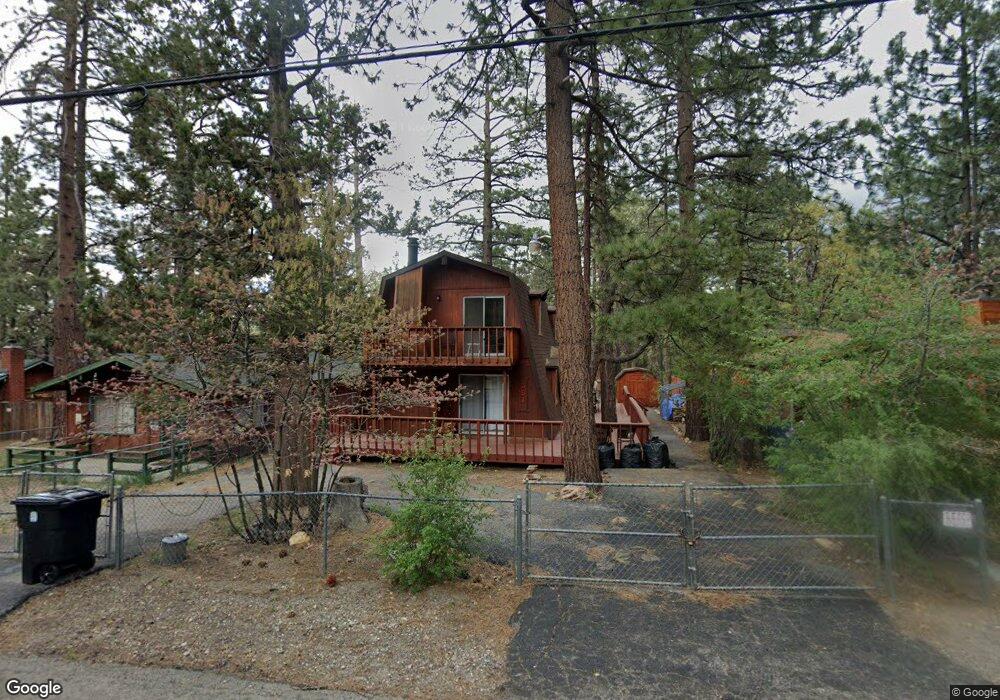
351 Holmes Ln Sugarloaf, CA 92386
Estimated Value: $377,564 - $424,000
4
Beds
2
Baths
1,591
Sq Ft
$253/Sq Ft
Est. Value
About This Home
This home is located at 351 Holmes Ln, Sugarloaf, CA 92386 and is currently estimated at $402,141, approximately $252 per square foot. 351 Holmes Ln is a home with nearby schools including Baldwin Lane Elementary School, Big Bear Middle School, and Big Bear High School.
Ownership History
Date
Name
Owned For
Owner Type
Purchase Details
Closed on
Sep 14, 2021
Sold by
Stringfield Robert and Stringfield Isabel
Bought by
Stringfield Robert C and Stringfield Isabel
Current Estimated Value
Purchase Details
Closed on
Sep 11, 2012
Sold by
Steelman Denny R and Steelman Danny R
Bought by
Stringfield Robert and Stringfield Isabel
Home Financials for this Owner
Home Financials are based on the most recent Mortgage that was taken out on this home.
Original Mortgage
$111,750
Outstanding Balance
$77,363
Interest Rate
3.58%
Mortgage Type
New Conventional
Estimated Equity
$324,778
Create a Home Valuation Report for This Property
The Home Valuation Report is an in-depth analysis detailing your home's value as well as a comparison with similar homes in the area
Home Values in the Area
Average Home Value in this Area
Purchase History
| Date | Buyer | Sale Price | Title Company |
|---|---|---|---|
| Stringfield Robert C | -- | Usa National Title Co | |
| Stringfield Robert | $149,000 | Chicago Title |
Source: Public Records
Mortgage History
| Date | Status | Borrower | Loan Amount |
|---|---|---|---|
| Open | Stringfield Robert | $111,750 |
Source: Public Records
Tax History
| Year | Tax Paid | Tax Assessment Tax Assessment Total Assessment is a certain percentage of the fair market value that is determined by local assessors to be the total taxable value of land and additions on the property. | Land | Improvement |
|---|---|---|---|---|
| 2025 | $3,309 | $183,483 | $36,697 | $146,786 |
| 2024 | $3,159 | $179,885 | $35,977 | $143,908 |
| 2023 | $3,057 | $176,358 | $35,272 | $141,086 |
| 2022 | $2,938 | $172,900 | $34,580 | $138,320 |
| 2021 | $2,873 | $169,510 | $33,902 | $135,608 |
| 2020 | $2,873 | $167,772 | $33,554 | $134,218 |
| 2019 | $2,804 | $164,482 | $32,896 | $131,586 |
| 2018 | $2,698 | $161,257 | $32,251 | $129,006 |
| 2017 | $2,624 | $158,095 | $31,619 | $126,476 |
| 2016 | $2,559 | $154,995 | $30,999 | $123,996 |
| 2015 | $2,518 | $152,666 | $30,533 | $122,133 |
| 2014 | $2,467 | $149,676 | $29,935 | $119,741 |
Source: Public Records
Map
Nearby Homes
Your Personal Tour Guide
Ask me questions while you tour the home.