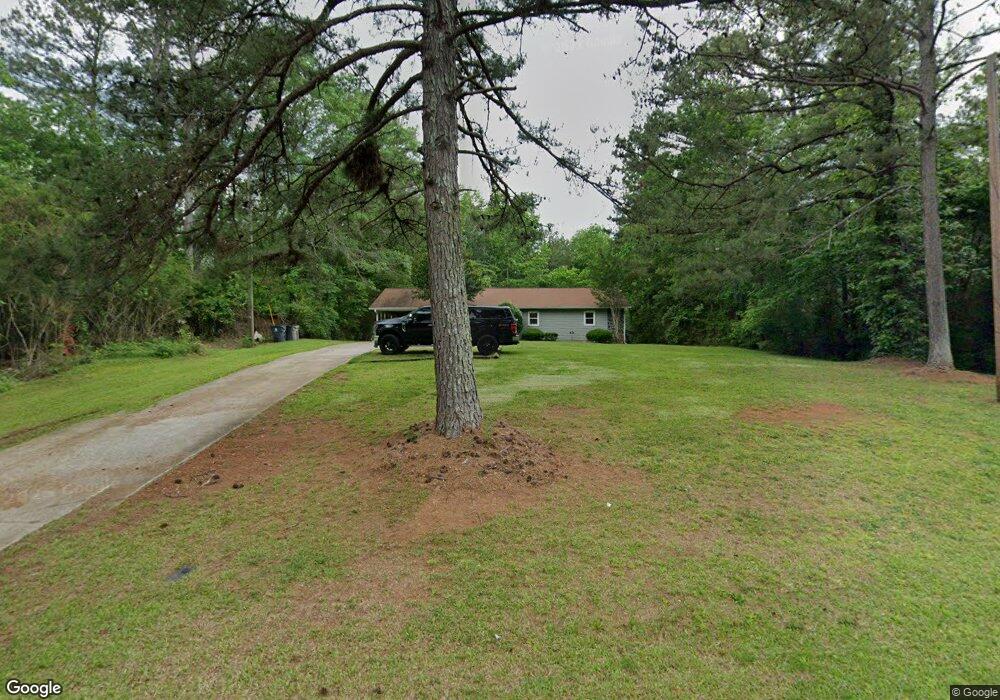
351 Ishman Ballard Rd Newnan, GA 30263
Estimated Value: $208,203 - $263,000
3
Beds
1
Bath
1,137
Sq Ft
$203/Sq Ft
Est. Value
About This Home
This home is located at 351 Ishman Ballard Rd, Newnan, GA 30263 and is currently estimated at $230,301, approximately $202 per square foot. 351 Ishman Ballard Rd is a home located in Coweta County with nearby schools including Ruth Hill Elementary School, Smokey Road Middle School, and Newnan High School.
Ownership History
Date
Name
Owned For
Owner Type
Purchase Details
Closed on
Sep 24, 2010
Sold by
Federal Natl Mtg Assn Fnma
Bought by
Fisher John P
Current Estimated Value
Home Financials for this Owner
Home Financials are based on the most recent Mortgage that was taken out on this home.
Original Mortgage
$30,550
Outstanding Balance
$20,173
Interest Rate
4.44%
Mortgage Type
New Conventional
Estimated Equity
$210,128
Purchase Details
Closed on
Mar 2, 2010
Sold by
Suntrust Mtg Inc
Bought by
Federal Natl Mtg Assn Fnma
Purchase Details
Closed on
Jan 17, 2007
Sold by
Hunt Jim
Bought by
Marshall Gary
Home Financials for this Owner
Home Financials are based on the most recent Mortgage that was taken out on this home.
Original Mortgage
$79,000
Interest Rate
6.05%
Mortgage Type
New Conventional
Purchase Details
Closed on
Mar 17, 1994
Bought by
Hunt Jim
Purchase Details
Closed on
Nov 30, 1976
Bought by
Ballard Clotie Hicks
Create a Home Valuation Report for This Property
The Home Valuation Report is an in-depth analysis detailing your home's value as well as a comparison with similar homes in the area
Home Values in the Area
Average Home Value in this Area
Purchase History
| Date | Buyer | Sale Price | Title Company |
|---|---|---|---|
| Fisher John P | -- | -- | |
| Federal Natl Mtg Assn Fnma | -- | -- | |
| Suntrust Mtg Inc | $86,442 | -- | |
| Marshall Gary | $75,000 | -- | |
| Hunt Jim | $6,000 | -- | |
| Ballard Clotie Hicks | -- | -- | |
| Walker Essie Mae | -- | -- |
Source: Public Records
Mortgage History
| Date | Status | Borrower | Loan Amount |
|---|---|---|---|
| Open | Fisher John P | $30,550 | |
| Previous Owner | Marshall Gary | $79,000 |
Source: Public Records
Tax History Compared to Growth
Tax History
| Year | Tax Paid | Tax Assessment Tax Assessment Total Assessment is a certain percentage of the fair market value that is determined by local assessors to be the total taxable value of land and additions on the property. | Land | Improvement |
|---|---|---|---|---|
| 2024 | $1,451 | $62,504 | $6,180 | $56,325 |
| 2023 | $1,451 | $60,973 | $8,017 | $52,956 |
| 2022 | $1,204 | $48,871 | $5,344 | $43,527 |
| 2021 | $1,102 | $41,874 | $5,090 | $36,784 |
| 2020 | $1,110 | $41,874 | $5,090 | $36,784 |
| 2019 | $978 | $33,406 | $7,870 | $25,536 |
| 2018 | $979 | $33,406 | $7,870 | $25,536 |
| 2017 | $979 | $33,406 | $7,869 | $25,537 |
| 2016 | $831 | $33,406 | $7,870 | $25,536 |
| 2015 | $820 | $33,406 | $7,870 | $25,536 |
| 2014 | $816 | $33,406 | $7,870 | $25,536 |
Source: Public Records
Map
Nearby Homes
- Zoey II Plan at Chapel Hill
- Middleton Plan at Chapel Hill
- Radcliffe Plan at Chapel Hill
- Horizon Plan at Chapel Hill
- Alexis Plan at Chapel Hill
- Reagan Plan at Chapel Hill
- Millhaven Plan at Chapel Hill
- Drayton Plan at Chapel Hill
- Everest III Plan at Chapel Hill
- Jordan Plan at Chapel Hill
- 16 Fayme Ct
- 48 Wallace Gray Ct
- 130 Wallace Gray Cir
- 144 Chapel Hill Pkwy
- 21 Bellamy Cove
- 29 Bellamy Cove
- 165 Homesite Chapel Hill Pkwy
- 26 Bellamy Cove
- 124 Wallace Gray Cir
- 14 Bellamy Cove
- 371 Ishman Ballard Rd
- 303 Ishman Ballard Rd
- 181 Derring Cir
- 381 Ishman Ballard Rd
- 136 Derring Cir
- 281 Ishman Ballard Rd
- ZERO Ishman Ballard Rd
- .865 acres Ishman Ballard Rd
- 255 Ishman Ballard Rd
- 93 Derring Cir
- ZERO Derring Cir
- 233 Ishman Ballard Rd
- 217 Isham Ballard Rd
- 217 Ishman Ballard Rd Unit 1
- 217 Ishman Ballard Rd
- 650 Ishman Ballard Rd
- 475 Ishman Ballard Rd
- 49 Derring Cir
- 502 Ishman Ballard Rd Unit 1
- 39 Derring Cir