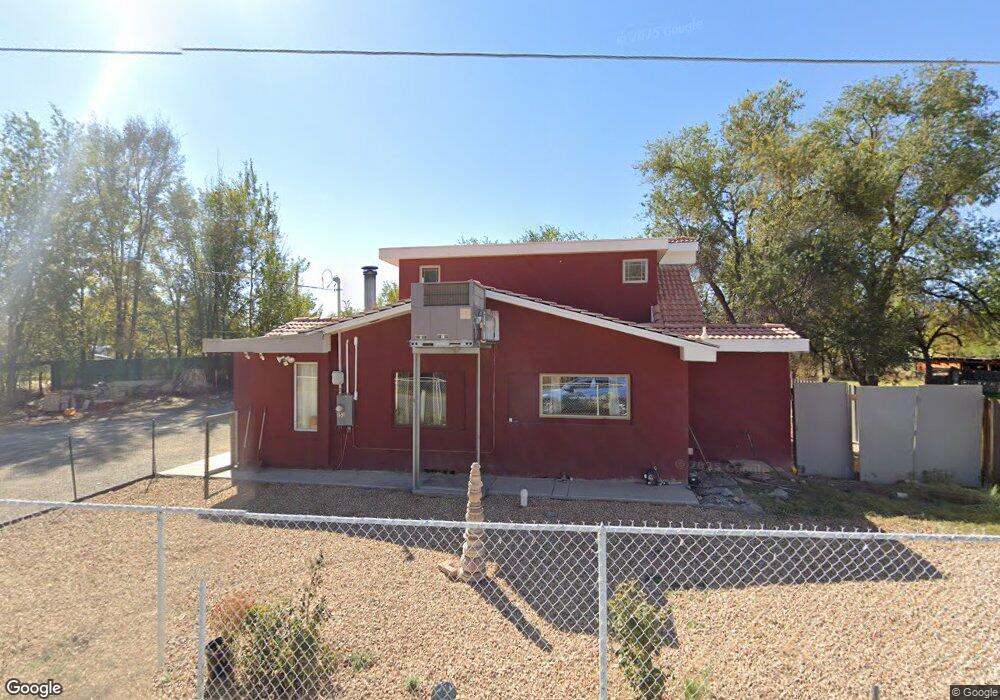
351 Lopez Rd SE Los Lunas, NM 87031
Estimated Value: $110,000 - $208,000
2
Beds
1
Bath
815
Sq Ft
$199/Sq Ft
Est. Value
About This Home
This home is located at 351 Lopez Rd SE, Los Lunas, NM 87031 and is currently estimated at $162,219, approximately $199 per square foot. 351 Lopez Rd SE is a home located in Valencia County with nearby schools including Los Lunas Elementary School, Los Lunas Middle School, and Los Lunas High School.
Ownership History
Date
Name
Owned For
Owner Type
Purchase Details
Closed on
Aug 29, 2022
Sold by
Trujillo John D
Bought by
Ortiz Guillermo and Burciaga Neidy Yohana
Current Estimated Value
Purchase Details
Closed on
Apr 18, 2017
Sold by
Wolverine Mgt Services Llc
Bought by
Trujillo John D
Purchase Details
Closed on
Aug 4, 2015
Sold by
Rocktop Partners I Lp
Bought by
Wolverine Mgt Services Llc
Purchase Details
Closed on
Sep 26, 2014
Sold by
Stonecrest Income And Opportunity Fund I
Bought by
Rocktop Partners I Lp
Purchase Details
Closed on
Nov 30, 2011
Sold by
Springleaf Financial Services Inc
Bought by
Stonecrest Income And Opportunity Fund I
Purchase Details
Closed on
Oct 22, 2010
Sold by
Chavez Mallory John and Chavez Mallory Carol
Bought by
American General Financial Services Inc
Create a Home Valuation Report for This Property
The Home Valuation Report is an in-depth analysis detailing your home's value as well as a comparison with similar homes in the area
Home Values in the Area
Average Home Value in this Area
Purchase History
| Date | Buyer | Sale Price | Title Company |
|---|---|---|---|
| Ortiz Guillermo | $77,165 | Centric Title | |
| Trujillo John D | -- | None Available | |
| Wolverine Mgt Services Llc | -- | None Available | |
| Rocktop Partners I Lp | -- | None Available | |
| Stonecrest Income And Opportunity Fund I | -- | None Available | |
| American General Financial Services Inc | $76,567 | -- |
Source: Public Records
Tax History Compared to Growth
Tax History
| Year | Tax Paid | Tax Assessment Tax Assessment Total Assessment is a certain percentage of the fair market value that is determined by local assessors to be the total taxable value of land and additions on the property. | Land | Improvement |
|---|---|---|---|---|
| 2024 | $527 | $13,455 | $8,646 | $4,809 |
| 2023 | $509 | $13,063 | $8,628 | $4,435 |
| 2022 | $487 | $12,682 | $8,605 | $4,077 |
| 2021 | $477 | $12,313 | $8,583 | $3,730 |
| 2020 | $470 | $11,954 | $8,333 | $3,621 |
| 2019 | $459 | $11,606 | $8,333 | $3,273 |
| 2018 | $452 | $11,606 | $8,333 | $3,273 |
| 2017 | $377 | $11,606 | $8,333 | $3,273 |
| 2016 | $375 | $11,606 | $8,333 | $3,273 |
| 2015 | -- | $11,606 | $8,333 | $3,273 |
| 2013 | -- | $5,473 | $2,702 | $2,771 |
| 2011 | -- | $15,939 | $7,869 | $8,070 |
Source: Public Records
Map
Nearby Homes
- 259 Lopez Rd SE
- 1604 Juan Perea Rd
- 1152 Los Nardos
- 1015 Manzano Ave SE
- 1235 Highway 314 SW
- 3892 Hernandez St SW
- 1118 Las Rosas Dr SE
- 1030 Aspen Ct
- 668 Helen Cir
- 0 Carson Dr
- 441 Colonial Ave SW
- 461 Los Lentes Rd SE
- 1160 Pine Ct SE
- 344 Los Lentes Rd SE
- 156 Edeal Rd
- 325 Verde Dr SW
- 600 Don Federico Ct SW
- 414 Adeline Ave SW
- 435 Adeline Ave SW
- 0 Rio Del Oro: Lot: 40 Unit 12 1073698
- 0 Lopez Rd SE
- 1419 Los Lentes Rd SE
- 352 Lopez Rd SE
- 328 Lopez Rd SE
- 1501 Los Lentes Rd SE
- 1501 Los Lentes Rd SE
- 338 Lopez Rd SE
- 362 Lopez Rd SE
- 269 Lopez Rd SE
- 301 Lopez Rd SE
- 278 Gonzales Ln SE
- 1012 Archuleta Ct
- 1011 Archuleta Ct
- 267 Lopez Rd SE
- 283 Gonzales Ln SE
- 268 Gonzales Ln SE
- 1003 Aragon Ct SE
- 1003 Aragon Ct
- 1004 Castillo Ct SE
- 0 Archuleta Ct