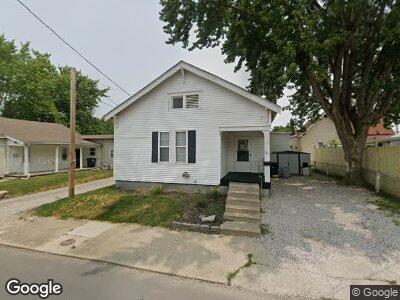
351 Sims St Frankfort, IN 46041
Estimated Value: $128,000 - $153,000
3
Beds
1
Bath
1,165
Sq Ft
$124/Sq Ft
Est. Value
About This Home
This home is located at 351 Sims St, Frankfort, IN 46041 and is currently estimated at $144,549, approximately $124 per square foot. 351 Sims St is a home located in Clinton County with nearby schools including Frankfort Senior High School and Frankfort Covenant Academy.
Ownership History
Date
Name
Owned For
Owner Type
Purchase Details
Closed on
Nov 30, 2016
Sold by
Mathews Michael L
Bought by
Polston Michael Shawn and Polston Melanie Lynn
Current Estimated Value
Purchase Details
Closed on
Sep 14, 2011
Sold by
Mathews Michael L
Bought by
Polston Michael S
Purchase Details
Closed on
Jul 6, 2001
Sold by
Cornerstone Real Estate Llc
Bought by
Baker Christopher Lee
Purchase Details
Closed on
May 8, 2001
Sold by
Crum Kelly S
Bought by
Cornerstone Real Estate Llc
Purchase Details
Closed on
May 7, 2001
Sold by
Federal Home Loan Mortgage Corporation
Bought by
Crum Kelly S
Purchase Details
Closed on
Nov 6, 2000
Sold by
Trinity Mortgage Co Of Dallas
Bought by
Federal Home Loan Mortgage Corporation
Purchase Details
Closed on
Nov 5, 2000
Sold by
Boggs Dorothy L and Johnson Marlene J
Bought by
Trinity Mortgage Company Of Dallas
Purchase Details
Closed on
May 6, 1999
Sold by
Day Amanda L
Bought by
Likens Anita May
Create a Home Valuation Report for This Property
The Home Valuation Report is an in-depth analysis detailing your home's value as well as a comparison with similar homes in the area
Home Values in the Area
Average Home Value in this Area
Purchase History
| Date | Buyer | Sale Price | Title Company |
|---|---|---|---|
| Polston Michael Shawn | -- | None Available | |
| Polston Michael S | $12,500 | Morrison'S Abstract & Title | |
| Baker Christopher Lee | $66,900 | -- | |
| Crum Kelly S | $42,000 | -- | |
| Federal Home Loan Mortgage Corporation | -- | -- | |
| Likens Anita May | $60,600 | -- |
Source: Public Records
Mortgage History
| Date | Status | Borrower | Loan Amount |
|---|---|---|---|
| Closed | Likens Anita May | $0 |
Source: Public Records
Tax History Compared to Growth
Tax History
| Year | Tax Paid | Tax Assessment Tax Assessment Total Assessment is a certain percentage of the fair market value that is determined by local assessors to be the total taxable value of land and additions on the property. | Land | Improvement |
|---|---|---|---|---|
| 2024 | $1,854 | $82,600 | $5,700 | $76,900 |
| 2023 | $1,639 | $71,200 | $5,700 | $65,500 |
| 2022 | $1,372 | $59,900 | $5,700 | $54,200 |
| 2021 | $896 | $38,800 | $5,700 | $33,100 |
| 2020 | $921 | $38,800 | $5,700 | $33,100 |
| 2019 | $923 | $38,800 | $5,700 | $33,100 |
| 2018 | $913 | $38,800 | $5,700 | $33,100 |
| 2017 | $680 | $28,400 | $5,600 | $22,800 |
| 2016 | $661 | $27,300 | $5,600 | $21,700 |
| 2014 | $540 | $27,000 | $5,600 | $21,400 |
Source: Public Records
Map
Nearby Homes
- 559 Catterlin St
- 659 Washington Ave
- 657 Burlington Ave
- 0 E State Road 28 Unit MBR21952079
- 400 S Clay St
- 900 N Harrison St
- 258 E South St
- 1309 E Washington St
- 1109 E Wabash St
- 557 E Boone St
- 609 E Armstrong St
- 751 E Armstrong St
- 52 E Palmer St
- 600 S Clay St
- 458 S Jackson St
- 559 S Oneil St
- 402 S Main St
- 1061 N Jackson St
- 1510 E Walnut St
- 1501 E Walnut St
- 351 Sims St
- 352 Washington Ave
- 357 Sims St
- 356 Washington Ave
- 350 Sims St Unit 352
- 354 Sims St
- 401 Sims St
- 358 Sims St
- 404 Washington Ave
- 308 Washington Ave
- 308 Washington Ave Unit 4
- 359 Washington Ave
- 608 E Morrison St
- 601 E Morrison St
- 405 Washington Ave
- 409 Sims St
- 302 Washington Ave
- 600 E Morrison St
- 408 Sims St
- 408 Washington Ave