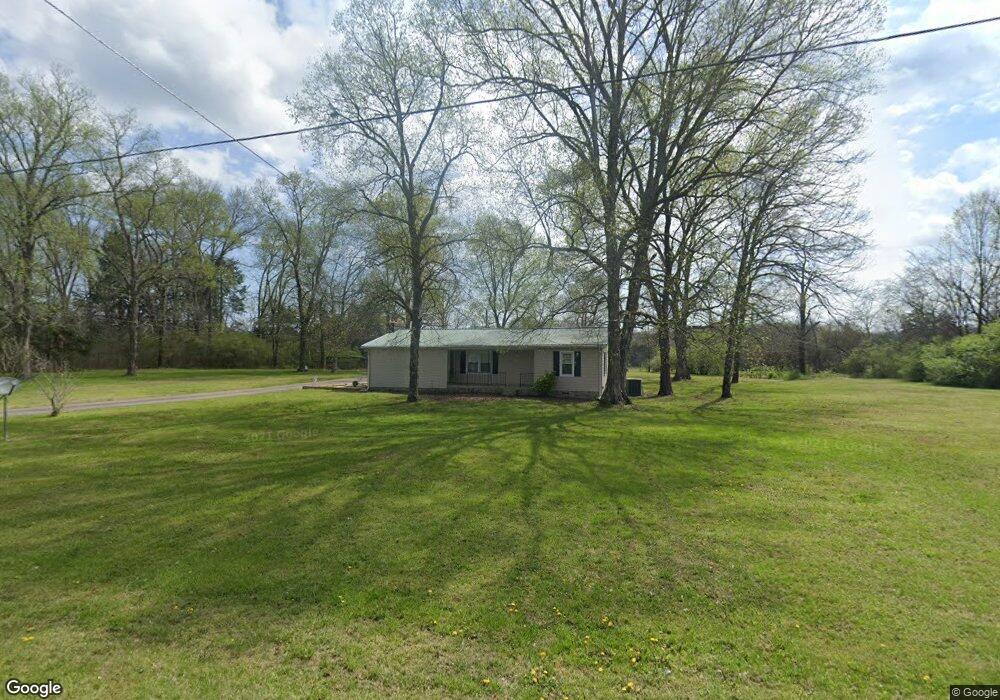
351 Sulphur Springs Rd Shelbyville, TN 37160
Estimated Value: $297,649 - $401,000
--
Bed
2
Baths
1,919
Sq Ft
$183/Sq Ft
Est. Value
About This Home
This home is located at 351 Sulphur Springs Rd, Shelbyville, TN 37160 and is currently estimated at $350,662, approximately $182 per square foot. 351 Sulphur Springs Rd is a home located in Bedford County with nearby schools including South Side Elementary School, Harris Middle School, and Christian Chapel Academy.
Ownership History
Date
Name
Owned For
Owner Type
Purchase Details
Closed on
Mar 11, 1997
Sold by
Wagoner Roger L
Bought by
Scott Dennis Lynette
Current Estimated Value
Purchase Details
Closed on
Sep 28, 1993
Bought by
Wagoner Roger L and Wagoner Judith K
Purchase Details
Closed on
Apr 1, 1967
Bought by
Mcadams Ernest Arthur and Jane Bel
Purchase Details
Closed on
Sep 25, 1964
Create a Home Valuation Report for This Property
The Home Valuation Report is an in-depth analysis detailing your home's value as well as a comparison with similar homes in the area
Home Values in the Area
Average Home Value in this Area
Purchase History
| Date | Buyer | Sale Price | Title Company |
|---|---|---|---|
| Scott Dennis Lynette | $78,000 | -- | |
| Wagoner Roger L | $47,000 | -- | |
| Mcadams Ernest Arthur | -- | -- | |
| -- | -- | -- |
Source: Public Records
Tax History Compared to Growth
Tax History
| Year | Tax Paid | Tax Assessment Tax Assessment Total Assessment is a certain percentage of the fair market value that is determined by local assessors to be the total taxable value of land and additions on the property. | Land | Improvement |
|---|---|---|---|---|
| 2025 | $1,191 | $51,200 | $0 | $0 |
| 2024 | $1,191 | $51,200 | $10,275 | $40,925 |
| 2023 | $1,191 | $51,200 | $10,275 | $40,925 |
| 2022 | $1,191 | $51,200 | $10,275 | $40,925 |
| 2021 | $1,006 | $51,200 | $10,275 | $40,925 |
| 2020 | $931 | $51,200 | $10,275 | $40,925 |
| 2019 | $931 | $35,000 | $6,625 | $28,375 |
| 2018 | $896 | $35,000 | $6,625 | $28,375 |
| 2017 | $896 | $35,000 | $6,625 | $28,375 |
| 2016 | $882 | $35,000 | $6,625 | $28,375 |
| 2015 | $882 | $35,000 | $6,625 | $28,375 |
| 2014 | $692 | $30,504 | $0 | $0 |
Source: Public Records
Map
Nearby Homes
- 201 Sulphur Springs Rd
- 128 Riverlake Rd
- 0 Highway 130 E
- 1519 Highway 130 E
- 315 Woodland Dr
- 1413 Highway 130 E
- 0 Himesville Rd
- 602 Narrows Rd
- 495 Himesville Rd
- 455 Himesville Rd
- 222 Carter St
- 209 Gladys Dr
- 215 Coney Island Rd
- 102 Germantown Rd
- 310 Crest Dr
- 120 Dogwood Ct
- 1024 Tennessee 64
- 211 S Fairoak St
- 231 Riverbend Country Club Rd
- 339 Riverbend Country Club Rd
- 355 Sulphur Springs Rd
- 350 Sulphur Springs Rd
- 365 Sulphur Springs Rd
- 335 Sulphur Springs Rd
- 346 Sulphur Springs Rd
- 369 Sulphur Springs Rd
- 333 Sulphur Springs Rd
- 371 Sulphur Springs Rd
- 329 Sulphur Springs Rd
- 342 Sulphur Springs Rd
- 325 Sulphur Springs Rd
- 380 Sulphur Springs Rd
- 1205 Highway 82 S
- 1207 Tennessee 82
- 1201 Highway 82 S
- 1201 Highway 82 S
- 1105 Tennessee 82
- 44 Hwy 82 S
- 1209 Highway 82 S
- 1097 Highway 82 S