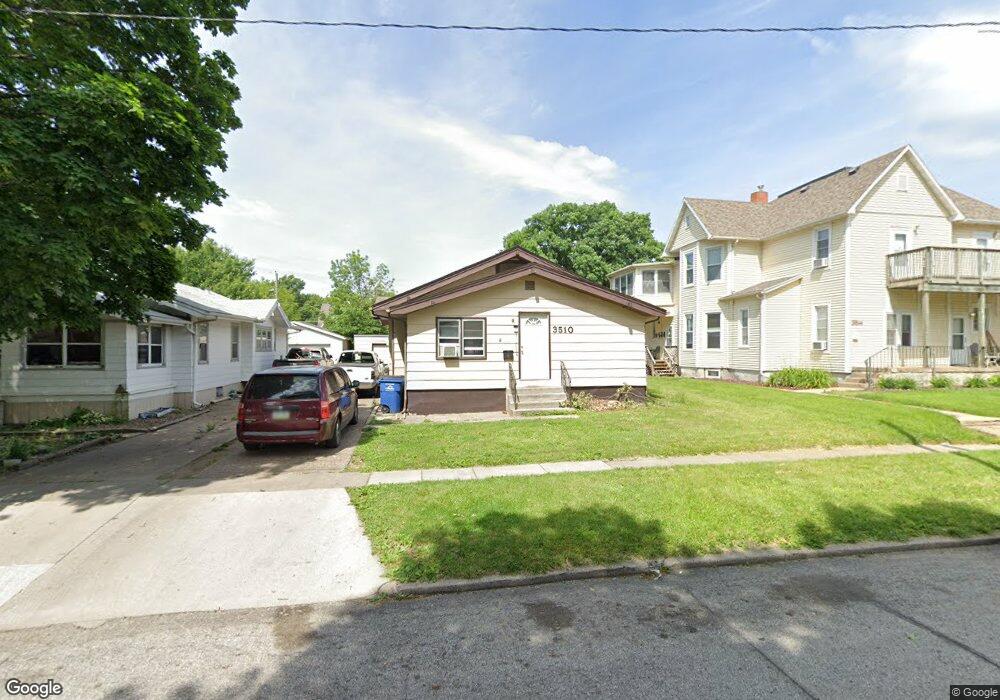
3510 3rd St Des Moines, IA 50313
Highland Park NeighborhoodEstimated Value: $132,000 - $170,000
3
Beds
1
Bath
1,188
Sq Ft
$127/Sq Ft
Est. Value
About This Home
This home is located at 3510 3rd St, Des Moines, IA 50313 and is currently estimated at $151,148, approximately $127 per square foot. 3510 3rd St is a home located in Polk County with nearby schools including Oak Park Elementary School, Harding Middle School, and North High School.
Ownership History
Date
Name
Owned For
Owner Type
Purchase Details
Closed on
Dec 30, 2022
Sold by
Lehs Kent E and Lehs Beverly K
Bought by
Btb Investments 2 Llc
Current Estimated Value
Home Financials for this Owner
Home Financials are based on the most recent Mortgage that was taken out on this home.
Original Mortgage
$78,000
Outstanding Balance
$72,319
Interest Rate
6.58%
Mortgage Type
New Conventional
Estimated Equity
$78,829
Purchase Details
Closed on
Jul 13, 2012
Sold by
Hernandez Sonia M and Hernandez Jose J
Bought by
Lehs Kent and Lehs Beverly
Purchase Details
Closed on
Sep 24, 2009
Sold by
Lehs Kent and Lehs Beverly
Bought by
Hernandez Sonia and Hernandez Jose
Home Financials for this Owner
Home Financials are based on the most recent Mortgage that was taken out on this home.
Original Mortgage
$78,500
Interest Rate
5.38%
Mortgage Type
Seller Take Back
Create a Home Valuation Report for This Property
The Home Valuation Report is an in-depth analysis detailing your home's value as well as a comparison with similar homes in the area
Home Values in the Area
Average Home Value in this Area
Purchase History
| Date | Buyer | Sale Price | Title Company |
|---|---|---|---|
| Btb Investments 2 Llc | $112,000 | -- | |
| Lehs Kent | -- | None Available | |
| Hernandez Sonia | $88,500 | None Available |
Source: Public Records
Mortgage History
| Date | Status | Borrower | Loan Amount |
|---|---|---|---|
| Open | Btb Investments 2 Llc | $78,000 | |
| Previous Owner | Hernandez Sonia | $78,500 |
Source: Public Records
Tax History Compared to Growth
Tax History
| Year | Tax Paid | Tax Assessment Tax Assessment Total Assessment is a certain percentage of the fair market value that is determined by local assessors to be the total taxable value of land and additions on the property. | Land | Improvement |
|---|---|---|---|---|
| 2025 | $2,182 | $127,700 | $28,900 | $98,800 |
| 2024 | $2,182 | $110,900 | $25,100 | $85,800 |
| 2023 | $2,126 | $110,900 | $25,100 | $85,800 |
| 2022 | $2,110 | $90,200 | $21,200 | $69,000 |
| 2021 | $1,996 | $90,200 | $21,200 | $69,000 |
| 2020 | $2,074 | $80,000 | $19,000 | $61,000 |
| 2019 | $1,972 | $80,000 | $19,000 | $61,000 |
| 2018 | $1,952 | $73,400 | $17,300 | $56,100 |
| 2017 | $1,794 | $73,400 | $17,300 | $56,100 |
| 2016 | $1,748 | $66,300 | $15,500 | $50,800 |
| 2015 | $1,748 | $66,300 | $15,500 | $50,800 |
| 2014 | $1,632 | $61,400 | $14,300 | $47,100 |
Source: Public Records
Map
Nearby Homes