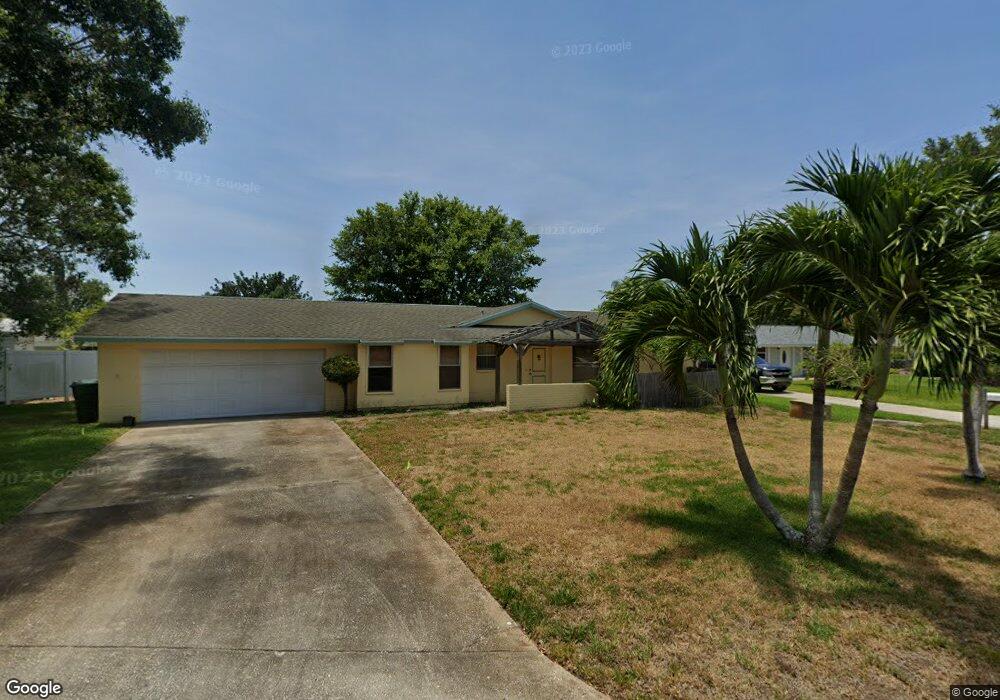
3510 62nd St W Bradenton, FL 34209
West Bradenton NeighborhoodEstimated Value: $327,000 - $401,000
2
Beds
4
Baths
1,246
Sq Ft
$296/Sq Ft
Est. Value
About This Home
This home is located at 3510 62nd St W, Bradenton, FL 34209 and is currently estimated at $368,766, approximately $295 per square foot. 3510 62nd St W is a home located in Manatee County with nearby schools including Sea Breeze Elementary School, W. D. Sugg Middle School, and Bayshore High School.
Ownership History
Date
Name
Owned For
Owner Type
Purchase Details
Closed on
Aug 15, 2016
Sold by
Richardson Barbara Anne and Richardson Peter
Bought by
Richardson Barbara Anne and Hatch Susan
Current Estimated Value
Purchase Details
Closed on
Jan 30, 2012
Sold by
Hatch Susan
Bought by
Richardson Barbara Anne
Purchase Details
Closed on
Apr 29, 2005
Sold by
Cole Darya
Bought by
Hatch Susan and Richardson Peter
Purchase Details
Closed on
Aug 13, 2004
Sold by
Herman John R and Herman Teresa L
Bought by
Cole Darya
Home Financials for this Owner
Home Financials are based on the most recent Mortgage that was taken out on this home.
Original Mortgage
$136,800
Interest Rate
6.5%
Mortgage Type
Purchase Money Mortgage
Purchase Details
Closed on
May 30, 2003
Sold by
Steele Betty Jane
Bought by
Herman John R and Herman Teresa L
Home Financials for this Owner
Home Financials are based on the most recent Mortgage that was taken out on this home.
Original Mortgage
$131,747
Interest Rate
5.79%
Mortgage Type
FHA
Create a Home Valuation Report for This Property
The Home Valuation Report is an in-depth analysis detailing your home's value as well as a comparison with similar homes in the area
Home Values in the Area
Average Home Value in this Area
Purchase History
| Date | Buyer | Sale Price | Title Company |
|---|---|---|---|
| Richardson Barbara Anne | -- | None Available | |
| Richardson Barbara Anne | -- | Attorney | |
| Hatch Susan | $218,000 | Barnes Walker Title Inc | |
| Cole Darya | $152,000 | -- | |
| Herman John R | $133,900 | -- |
Source: Public Records
Mortgage History
| Date | Status | Borrower | Loan Amount |
|---|---|---|---|
| Previous Owner | Cole Darya | $136,800 | |
| Previous Owner | Herman John R | $131,747 |
Source: Public Records
Tax History Compared to Growth
Tax History
| Year | Tax Paid | Tax Assessment Tax Assessment Total Assessment is a certain percentage of the fair market value that is determined by local assessors to be the total taxable value of land and additions on the property. | Land | Improvement |
|---|---|---|---|---|
| 2025 | $2,416 | $267,284 | -- | -- |
| 2024 | $2,416 | $281,748 | $79,050 | $202,698 |
| 2023 | $4,559 | $281,748 | $79,050 | $202,698 |
| 2022 | $4,143 | $249,376 | $70,000 | $179,376 |
| 2021 | $1,895 | $182,558 | $55,000 | $127,558 |
| 2020 | $3,326 | $169,520 | $45,000 | $124,520 |
| 2019 | $3,120 | $163,914 | $45,000 | $118,914 |
| 2018 | $0 | $154,181 | $40,000 | $114,181 |
| 2017 | $2,568 | $144,674 | $0 | $0 |
| 2016 | $2,380 | $131,715 | $0 | $0 |
| 2015 | $1,913 | $114,196 | $0 | $0 |
| 2014 | $1,913 | $94,566 | $0 | $0 |
| 2013 | $1,774 | $86,758 | $24,400 | $62,358 |
Source: Public Records
Map
Nearby Homes
- 3602 63rd St W
- 6205 34th Ave W
- 6104 39th Ave W Unit B
- 3706 66th St W
- 6713 35th Ave W
- 4199 66th Street Cir W Unit 4199
- 6132 29th Ave W Unit 6132
- 4158 66th Street Cir W Unit 4158
- 6801 34th Ave W
- 4184 66th Street Cir W Unit 4184
- 6803 34th Ave W
- 4210 66th Street Cir W
- 4108 66th Street Cir W Unit 4108
- 6209 Heritage Ln
- 4109 66th Street Cir W
- 6131 Heritage Ln
- 3302 69th St W
- 6504 Heritage Ln Unit 99
- 6904 Cortez Rd W Unit 124
- 3602 54th St W Unit D4