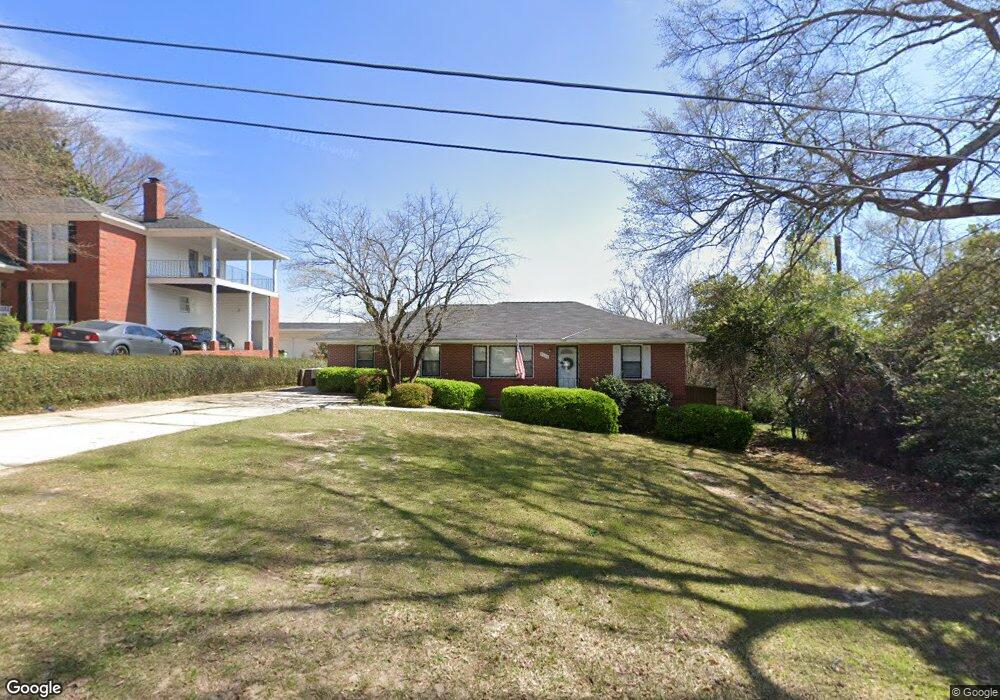
3510 Fuller St Columbus, GA 31907
Eastern Columbus NeighborhoodEstimated Value: $175,000 - $205,731
4
Beds
3
Baths
1,448
Sq Ft
$127/Sq Ft
Est. Value
About This Home
This home is located at 3510 Fuller St, Columbus, GA 31907 and is currently estimated at $183,933, approximately $127 per square foot. 3510 Fuller St is a home located in Muscogee County with nearby schools including Clubview Elementary School, Richards Middle School, and Hardaway High School.
Ownership History
Date
Name
Owned For
Owner Type
Purchase Details
Closed on
Sep 9, 2016
Sold by
Hud & Housing Of Urban Dev
Bought by
Faulkner Brett Chappell
Current Estimated Value
Home Financials for this Owner
Home Financials are based on the most recent Mortgage that was taken out on this home.
Original Mortgage
$62,614
Outstanding Balance
$51,093
Interest Rate
4.12%
Mortgage Type
FHA
Estimated Equity
$132,840
Purchase Details
Closed on
Oct 6, 2015
Sold by
Nationstar Mtg Llc
Bought by
Sec Of Housing & Urban
Purchase Details
Closed on
Dec 4, 2009
Sold by
Holley Lloyd
Bought by
Hill Rosie M
Home Financials for this Owner
Home Financials are based on the most recent Mortgage that was taken out on this home.
Original Mortgage
$125,681
Interest Rate
5.01%
Mortgage Type
FHA
Purchase Details
Closed on
Dec 4, 2007
Sold by
Banks B Gary
Bought by
Holley Lloyd
Home Financials for this Owner
Home Financials are based on the most recent Mortgage that was taken out on this home.
Original Mortgage
$90,000
Interest Rate
6.29%
Mortgage Type
Construction
Create a Home Valuation Report for This Property
The Home Valuation Report is an in-depth analysis detailing your home's value as well as a comparison with similar homes in the area
Home Values in the Area
Average Home Value in this Area
Purchase History
| Date | Buyer | Sale Price | Title Company |
|---|---|---|---|
| Faulkner Brett Chappell | $63,000 | -- | |
| Sec Of Housing & Urban | $68,761 | -- | |
| Nationstar Mtg Llc | $68,761 | -- | |
| Hill Rosie M | $128,000 | None Available | |
| Holley Lloyd | $124,000 | None Available |
Source: Public Records
Mortgage History
| Date | Status | Borrower | Loan Amount |
|---|---|---|---|
| Open | Faulkner Brett Chappell | $62,614 | |
| Previous Owner | Hill Rosie M | $125,681 | |
| Previous Owner | Holley Lloyd | $90,000 |
Source: Public Records
Tax History Compared to Growth
Tax History
| Year | Tax Paid | Tax Assessment Tax Assessment Total Assessment is a certain percentage of the fair market value that is determined by local assessors to be the total taxable value of land and additions on the property. | Land | Improvement |
|---|---|---|---|---|
| 2025 | $470 | $72,096 | $13,324 | $58,772 |
| 2024 | $469 | $72,096 | $13,324 | $58,772 |
| 2023 | $21 | $72,096 | $13,324 | $58,772 |
| 2022 | $489 | $59,132 | $13,324 | $45,808 |
| 2021 | $482 | $55,100 | $13,324 | $41,776 |
| 2020 | $482 | $55,100 | $13,324 | $41,776 |
| 2019 | $486 | $55,100 | $13,324 | $41,776 |
| 2018 | $486 | $55,100 | $13,324 | $41,776 |
| 2017 | $489 | $25,200 | $6,200 | $19,000 |
| 2016 | $2,111 | $51,181 | $3,300 | $47,881 |
| 2015 | $1,566 | $51,181 | $3,300 | $47,881 |
| 2014 | $1,569 | $51,181 | $3,300 | $47,881 |
| 2013 | -- | $51,181 | $3,300 | $47,881 |
Source: Public Records
Map
Nearby Homes
- 2525 Norris Rd Unit 36
- 2525 Norris Rd Unit 73
- 2525 Norris Rd Unit 91
- 2722 E Lindsay Dr
- 2 Kingswood Ct
- 3604 Norris Rd
- 8 Kingswood Ct
- 2576 Habersham Ave
- 3224 Carden Dr
- 3200 Tip Top Dr
- 3129 Avon Dr
- 2940 Birchfield Dr
- 3800 Woodmont Dr
- 3760 Mulberry Dr
- 3560 Woodland Dr
- 3562 Woodland Dr
- 1553 Violet Ave
- 3346 Junaluska Dr
- 8 Primrose Ct
- 1554 Holland Ave