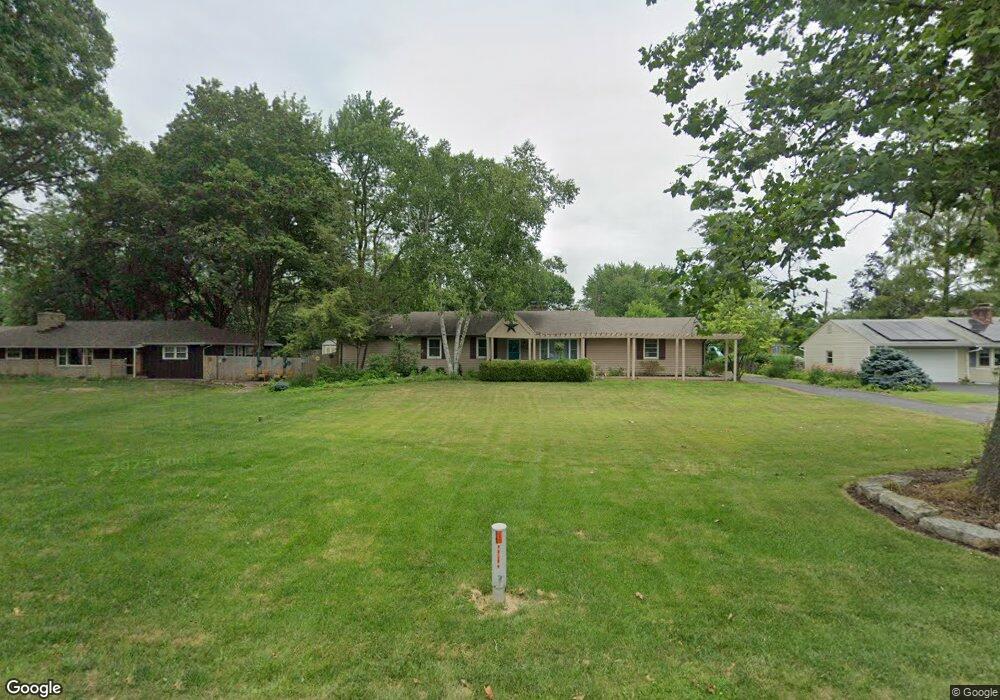
3510 Henderson Rd Columbus, OH 43220
Estimated Value: $538,000 - $686,000
3
Beds
2
Baths
1,619
Sq Ft
$369/Sq Ft
Est. Value
About This Home
This home is located at 3510 Henderson Rd, Columbus, OH 43220 and is currently estimated at $597,418, approximately $369 per square foot. 3510 Henderson Rd is a home located in Franklin County with nearby schools including Greensview Elementary School, Hastings Middle School, and Upper Arlington High School.
Ownership History
Date
Name
Owned For
Owner Type
Purchase Details
Closed on
Apr 25, 2018
Sold by
Brooks Keith A and Brooks Dawne R
Bought by
Peachey Scott W
Current Estimated Value
Home Financials for this Owner
Home Financials are based on the most recent Mortgage that was taken out on this home.
Original Mortgage
$344,375
Outstanding Balance
$296,157
Interest Rate
4.44%
Mortgage Type
New Conventional
Estimated Equity
$301,261
Purchase Details
Closed on
Jul 26, 2004
Sold by
Huey D Timothy and Huey Karen J
Bought by
Brooks Keith A and Brooks Dawne R
Home Financials for this Owner
Home Financials are based on the most recent Mortgage that was taken out on this home.
Original Mortgage
$224,329
Interest Rate
6.35%
Mortgage Type
VA
Purchase Details
Closed on
Nov 12, 1992
Bought by
Huey Huey D and Huey Karen J
Purchase Details
Closed on
Dec 1, 1986
Create a Home Valuation Report for This Property
The Home Valuation Report is an in-depth analysis detailing your home's value as well as a comparison with similar homes in the area
Home Values in the Area
Average Home Value in this Area
Purchase History
| Date | Buyer | Sale Price | Title Company |
|---|---|---|---|
| Peachey Scott W | $362,500 | None Available | |
| Brooks Keith A | $219,500 | -- | |
| Huey Huey D | $140,500 | -- | |
| -- | $95,500 | -- |
Source: Public Records
Mortgage History
| Date | Status | Borrower | Loan Amount |
|---|---|---|---|
| Open | Peachey Scott W | $344,375 | |
| Previous Owner | Brooks Keith A | $224,329 |
Source: Public Records
Tax History Compared to Growth
Tax History
| Year | Tax Paid | Tax Assessment Tax Assessment Total Assessment is a certain percentage of the fair market value that is determined by local assessors to be the total taxable value of land and additions on the property. | Land | Improvement |
|---|---|---|---|---|
| 2024 | $12,607 | $173,390 | $107,240 | $66,150 |
| 2023 | $11,163 | $173,390 | $107,240 | $66,150 |
| 2022 | $11,368 | $142,940 | $73,500 | $69,440 |
| 2021 | $10,362 | $142,940 | $73,500 | $69,440 |
| 2020 | $10,316 | $142,940 | $73,500 | $69,440 |
| 2019 | $10,508 | $126,880 | $73,500 | $53,380 |
| 2018 | $7,797 | $126,880 | $73,500 | $53,380 |
| 2017 | $8,330 | $140,420 | $73,500 | $66,920 |
| 2016 | $5,363 | $67,940 | $18,940 | $49,000 |
| 2015 | $5,359 | $67,940 | $18,940 | $49,000 |
| 2014 | $5,122 | $67,940 | $18,940 | $49,000 |
| 2013 | $2,558 | $64,680 | $18,025 | $46,655 |
Source: Public Records
Map
Nearby Homes
- 5055 Slate Run Woods Ct
- 5000 Slate Run Woods Ct
- 5227 Brynwood Dr
- 4499 Summit Ridge Rd
- 5322 Darlington Rd Unit E
- 5273 Brandy Oaks Ln
- 5275 Brandy Oaks Ln
- 5277 Brandy Oaks Ln
- 5297 Brandy Oaks Ln Unit 5297
- 5294 Brandy Oaks Ln
- 2491 Calais Way
- 2744 Greystone Dr Unit E
- 2522 Gardenia Dr Unit 16C
- 5283 Ruthton Rd Unit 19
- 2585 Trottersway Dr Unit 2585
- 4861 Etrick Dr Unit 22
- 2622 Trottersway Dr
- 2527 Maxim Ln Unit 40D
- 2560 Trotterslane Dr
- 2231 Atlee Ct Unit 12
- 3510 W Henderson Rd
- 3522 Henderson Rd
- 3490 Henderson Rd
- 3522 W Henderson Rd
- 4994 Henderson Heights Rd
- 4977 Charlbury Dr
- 5070 Slate Run Woods Ct
- 3528 Henderson Rd
- 5008 Henderson Heights Rd
- 5001 Charlbury Dr
- 3481 Henderson Rd
- 3451 Henderson Rd
- 3481 Henderson Rd
- 0 Slate Run Woods Ct Unit 2730986
- Lot 8 Slate Run Woods Ct
- 0 Slate Run Woods Ct Unit LOT1
- O Slate Run Woods Ct Unit LOT1
- 8 Slate Run Woods Ct
- 1 Slate Run Woods Ct
- 4 Slate Run Woods Ct