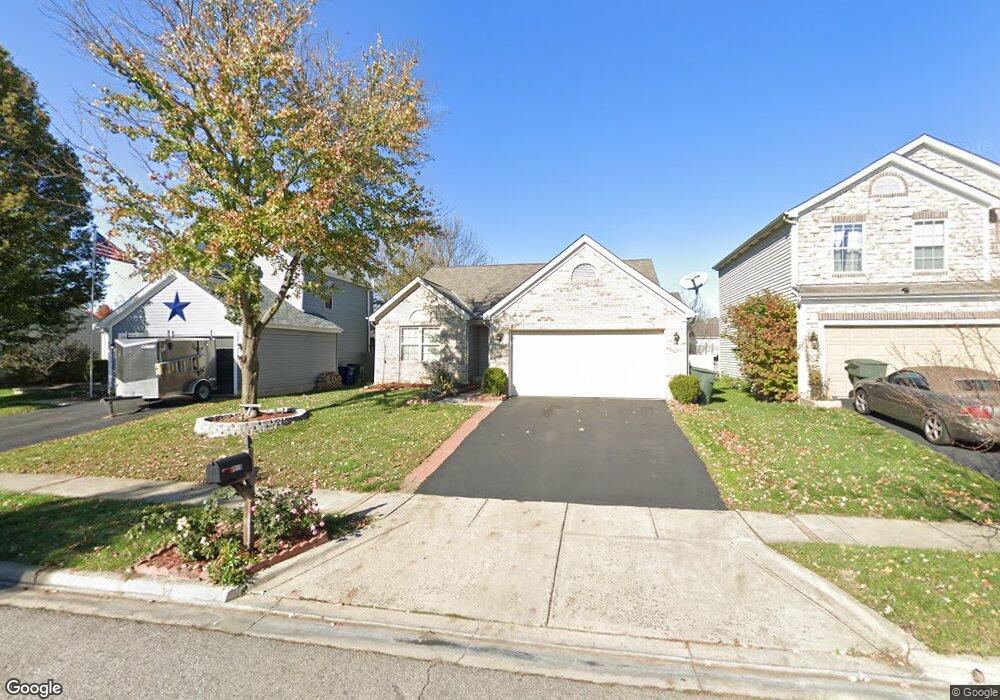
3510 Jonathan Noble Way Columbus, OH 43231
Parkview NeighborhoodEstimated Value: $334,516 - $385,000
3
Beds
2
Baths
1,622
Sq Ft
$218/Sq Ft
Est. Value
About This Home
This home is located at 3510 Jonathan Noble Way, Columbus, OH 43231 and is currently estimated at $353,129, approximately $217 per square foot. 3510 Jonathan Noble Way is a home located in Franklin County with nearby schools including Hawthorne Elementary School, Heritage Middle School, and Westerville South High School.
Ownership History
Date
Name
Owned For
Owner Type
Purchase Details
Closed on
Sep 26, 2006
Sold by
Wimsatt Christopher M and Wimsatt Nicole E
Bought by
Vu Hoan Q
Current Estimated Value
Home Financials for this Owner
Home Financials are based on the most recent Mortgage that was taken out on this home.
Original Mortgage
$175,249
Outstanding Balance
$104,748
Interest Rate
6.49%
Mortgage Type
FHA
Estimated Equity
$248,381
Purchase Details
Closed on
Feb 7, 2002
Sold by
M/I Schottenstein Homes Inc
Bought by
Wimsatt Christopher M and Wimsatt Nicole E
Home Financials for this Owner
Home Financials are based on the most recent Mortgage that was taken out on this home.
Original Mortgage
$188,181
Interest Rate
7.23%
Mortgage Type
FHA
Create a Home Valuation Report for This Property
The Home Valuation Report is an in-depth analysis detailing your home's value as well as a comparison with similar homes in the area
Home Values in the Area
Average Home Value in this Area
Purchase History
| Date | Buyer | Sale Price | Title Company |
|---|---|---|---|
| Vu Hoan Q | $178,000 | Esquire Tit | |
| Wimsatt Christopher M | $189,900 | Transohio Residential Title |
Source: Public Records
Mortgage History
| Date | Status | Borrower | Loan Amount |
|---|---|---|---|
| Open | Vu Hoan Q | $175,249 | |
| Previous Owner | Wimsatt Christopher M | $188,181 |
Source: Public Records
Tax History Compared to Growth
Tax History
| Year | Tax Paid | Tax Assessment Tax Assessment Total Assessment is a certain percentage of the fair market value that is determined by local assessors to be the total taxable value of land and additions on the property. | Land | Improvement |
|---|---|---|---|---|
| 2024 | $4,830 | $96,920 | $23,100 | $73,820 |
| 2023 | $4,713 | $96,915 | $23,100 | $73,815 |
| 2022 | $4,284 | $67,240 | $9,140 | $58,100 |
| 2021 | $4,326 | $67,240 | $9,140 | $58,100 |
| 2020 | $4,311 | $67,240 | $9,140 | $58,100 |
| 2019 | $3,616 | $53,800 | $7,320 | $46,480 |
| 2018 | $3,306 | $53,800 | $7,320 | $46,480 |
| 2017 | $3,544 | $53,800 | $7,320 | $46,480 |
| 2016 | $3,071 | $42,530 | $9,310 | $33,220 |
| 2015 | $3,078 | $42,530 | $9,310 | $33,220 |
| 2014 | $3,080 | $42,530 | $9,310 | $33,220 |
| 2013 | $2,039 | $56,525 | $10,360 | $46,165 |
Source: Public Records
Map
Nearby Homes
- 0 Blendon Bend Way Unit 225037483
- 3577 Frenchpark Dr
- 4748 Black Sycamore Dr
- 5047 Killowen Ct
- 4858 Farview Rd
- 3445 Steiner St
- 4864 Honeysuckle Blvd
- 4948 Black Sycamore Dr
- 4981 Black Sycamore Dr
- 3284 Valley Ln S Unit Z10
- 5112 Rosebud Ct
- 4555 Teton Ct
- 3955 Daffodil Dr
- 3392 Trail Lane Ct
- 3378 Trail Lane Ct
- 5226 Spring Beauty Ct
- 3854 Deer Knoll Dr
- 3457 Dristor Dr
- 5394 Ponderosa Dr Unit 5394
- 3292 Betty Ct
- 3518 Jonathan Noble Way
- 3502 Jonathan Noble Way
- 3526 Jonathan Noble Way
- 3494 Jonathan Noble Way
- 3503 Blendon Bend Way
- 3511 Blendon Bend Way
- 3495 Blendon Bend Way
- 3519 Blendon Bend Way
- 3534 Jonathan Noble Way
- 3487 Blendon Bend Way
- 3486 Jonathan Noble Way
- 3505 Jonathan Noble Way
- 3513 Jonathan Noble Way
- 3527 Blendon Bend Way
- 3497 Jonathan Noble Way
- 3521 Jonathan Noble Way
- 3479 Blendon Bend Way
- 0 Blendon Bend Way Unit 24 2227449
- 0 Blendon Bend Way Unit 27 2227451
- 0 Blendon Bend Way Unit 21