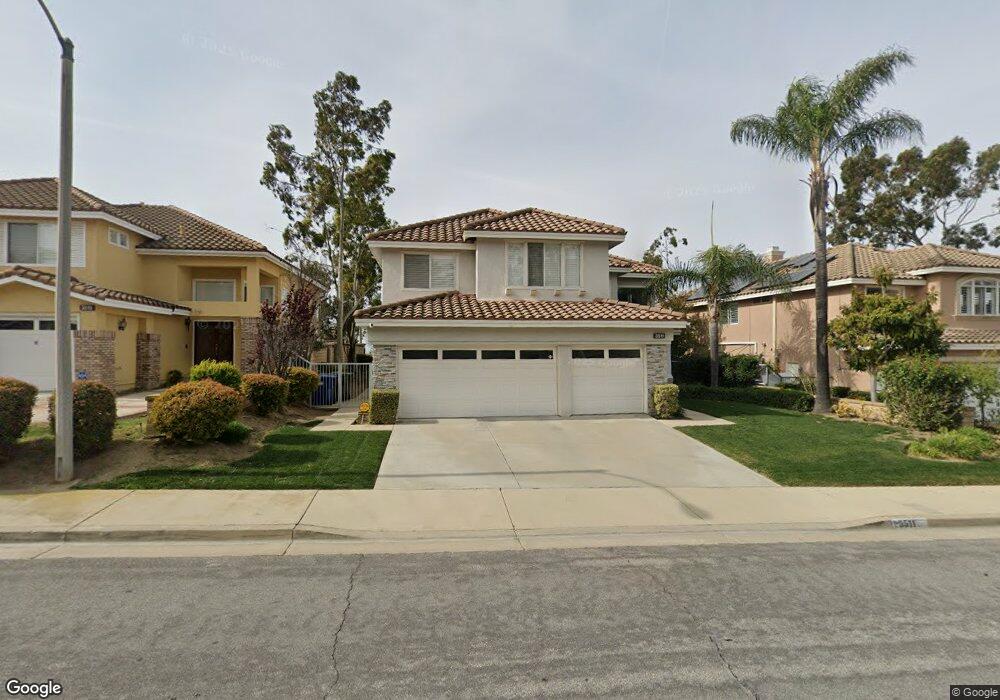
3511 Dartmouth Ln Rowland Heights, CA 91748
Estimated Value: $1,296,686 - $1,490,000
5
Beds
3
Baths
2,638
Sq Ft
$526/Sq Ft
Est. Value
About This Home
This home is located at 3511 Dartmouth Ln, Rowland Heights, CA 91748 and is currently estimated at $1,387,672, approximately $526 per square foot. 3511 Dartmouth Ln is a home located in Los Angeles County with nearby schools including Shelyn Elementary School, Alvarado Intermediate School, and John A. Rowland High School.
Ownership History
Date
Name
Owned For
Owner Type
Purchase Details
Closed on
Mar 12, 2019
Sold by
Cheng Erica Yu Wen and Cheng Erica Y
Bought by
Cheng Steven Shin Shen and Cheng Steven S
Current Estimated Value
Purchase Details
Closed on
Mar 22, 2010
Sold by
Wong Shu Kwang and Chuk Pauline Man Ching
Bought by
Cheng Steven S
Home Financials for this Owner
Home Financials are based on the most recent Mortgage that was taken out on this home.
Original Mortgage
$366,000
Interest Rate
4.95%
Mortgage Type
New Conventional
Purchase Details
Closed on
Dec 21, 1995
Sold by
Shea Homes Ltd Partnership
Bought by
Wong Shu Kwan and Chuk Pauline Man Ching
Home Financials for this Owner
Home Financials are based on the most recent Mortgage that was taken out on this home.
Original Mortgage
$207,000
Interest Rate
7.97%
Create a Home Valuation Report for This Property
The Home Valuation Report is an in-depth analysis detailing your home's value as well as a comparison with similar homes in the area
Home Values in the Area
Average Home Value in this Area
Purchase History
| Date | Buyer | Sale Price | Title Company |
|---|---|---|---|
| Cheng Steven Shin Shen | $455,000 | Stewart Title Of Ca Inc | |
| Cheng Steven S | $733,000 | Chicago Title Company | |
| Wong Shu Kwan | $320,000 | Chicago Title Insurance Co |
Source: Public Records
Mortgage History
| Date | Status | Borrower | Loan Amount |
|---|---|---|---|
| Previous Owner | Cheng Steven S | $366,000 | |
| Previous Owner | Wong Shu Kwan | $207,000 |
Source: Public Records
Tax History Compared to Growth
Tax History
| Year | Tax Paid | Tax Assessment Tax Assessment Total Assessment is a certain percentage of the fair market value that is determined by local assessors to be the total taxable value of land and additions on the property. | Land | Improvement |
|---|---|---|---|---|
| 2025 | $11,635 | $946,160 | $472,434 | $473,726 |
| 2024 | $11,635 | $927,609 | $463,171 | $464,438 |
| 2023 | $11,188 | $909,422 | $454,090 | $455,332 |
| 2022 | $10,893 | $891,591 | $445,187 | $446,404 |
| 2021 | $10,711 | $874,109 | $436,458 | $437,651 |
| 2019 | $10,381 | $848,184 | $423,513 | $424,671 |
| 2018 | $10,012 | $831,554 | $415,209 | $416,345 |
| 2016 | $12,764 | $799,266 | $399,087 | $400,179 |
| 2015 | $12,588 | $787,261 | $393,093 | $394,168 |
| 2014 | $12,280 | $771,840 | $385,393 | $386,447 |
Source: Public Records
Map
Nearby Homes
- 18489 Stonegate Ln
- 18109 Graystone Way
- 18559 Stonegate Ln
- 18555 Fieldbrook St
- 18593 Fieldbrook St
- 1010 Northwood Ave
- 18479 Aguiro St
- 1006 W Dorothy Dr
- 1318 Alta Mesa Dr
- 3038 Blakeman Ave
- 2426 Batson Ave
- 2190 Choral Dr
- 2634 Blandford Dr
- 2521 Doubletree Ln
- 2503 Toro Dr
- 1060 Tropicana Way
- 1223 El Encanto Dr
- 2503 Donosa Dr
- 18220 Gallineta St
- 18654 Del Bonita St
- 3515 Dartmouth Ln
- 3507 Dartmouth Ln
- 3519 Dartmouth Ln
- 3608 Norwich Place
- 3612 Norwich Place
- 3602 Norwich Place
- 3525 Dartmouth Ln
- 3616 Norwich Place
- 3502 Dartmouth Ln
- 3512 Dartmouth Ln
- 3516 Dartmouth Ln
- 3622 Norwich Place
- 3508 Dartmouth Ln
- 3529 Dartmouth Ln
- 3518 Dartmouth Ln
- 3526 Dartmouth Ln
- 3628 Norwich Place
- 3537 Dartmouth Ln
- 3530 Dartmouth Ln
- 3632 Norwich Place