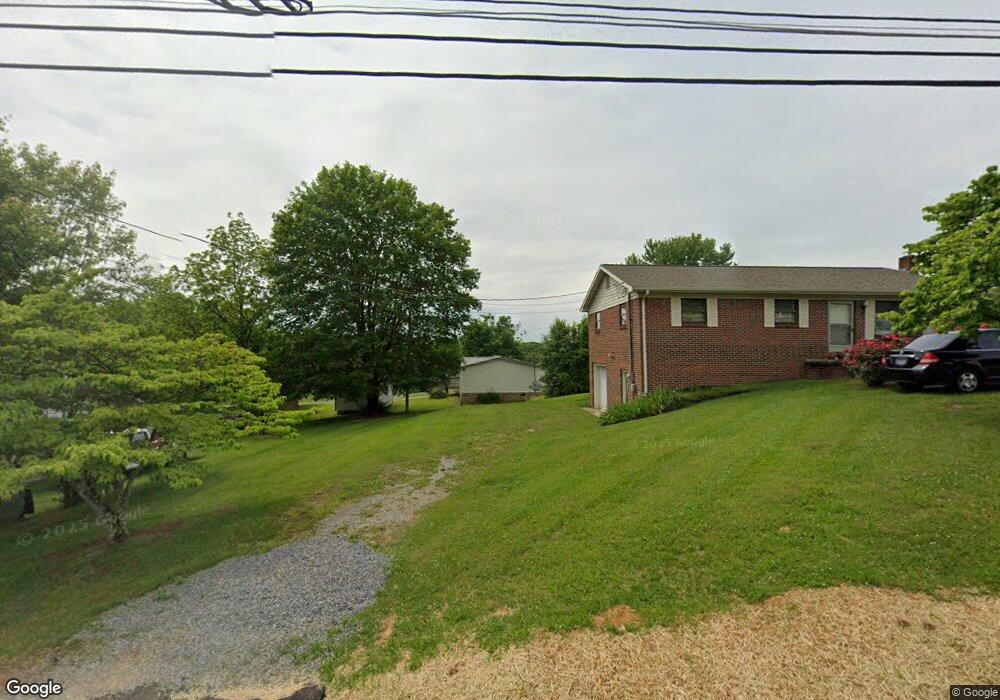
3511 Reeds Chapel Rd Morristown, TN 37814
Estimated Value: $151,000 - $183,000
--
Bed
2
Baths
1,080
Sq Ft
$156/Sq Ft
Est. Value
About This Home
This home is located at 3511 Reeds Chapel Rd, Morristown, TN 37814 and is currently estimated at $169,000, approximately $156 per square foot. 3511 Reeds Chapel Rd is a home located in Hamblen County with nearby schools including John Hay Elementary School, Meadowview Middle School, and Morristown East High School.
Ownership History
Date
Name
Owned For
Owner Type
Purchase Details
Closed on
Jun 10, 2014
Sold by
Vanderbilt Mtg And Finance Inc
Bought by
Adams Brandon S and Adams Leslie D
Current Estimated Value
Home Financials for this Owner
Home Financials are based on the most recent Mortgage that was taken out on this home.
Original Mortgage
$66,964
Outstanding Balance
$50,992
Interest Rate
4.23%
Mortgage Type
FHA
Estimated Equity
$118,008
Purchase Details
Closed on
May 16, 2013
Sold by
Matthews John M
Bought by
Vanderbilt Mtg And Finance Inc
Purchase Details
Closed on
Aug 4, 2006
Sold by
Greene Joan F
Bought by
John Matthews
Purchase Details
Closed on
Aug 14, 1992
Bought by
Greene Joan F
Purchase Details
Closed on
Sep 13, 1982
Bought by
Gregg Kim M
Purchase Details
Closed on
Jan 15, 1977
Create a Home Valuation Report for This Property
The Home Valuation Report is an in-depth analysis detailing your home's value as well as a comparison with similar homes in the area
Home Values in the Area
Average Home Value in this Area
Purchase History
| Date | Buyer | Sale Price | Title Company |
|---|---|---|---|
| Adams Brandon S | $68,200 | -- | |
| Vanderbilt Mtg And Finance Inc | $31,500 | -- | |
| John Matthews | $6,000 | -- | |
| Greene Joan F | $28,000 | -- | |
| Gregg Kim M | -- | -- | |
| -- | -- | -- |
Source: Public Records
Mortgage History
| Date | Status | Borrower | Loan Amount |
|---|---|---|---|
| Open | Adams Brandon S | $66,964 |
Source: Public Records
Tax History Compared to Growth
Tax History
| Year | Tax Paid | Tax Assessment Tax Assessment Total Assessment is a certain percentage of the fair market value that is determined by local assessors to be the total taxable value of land and additions on the property. | Land | Improvement |
|---|---|---|---|---|
| 2024 | $350 | $17,750 | $3,075 | $14,675 |
| 2023 | $350 | $17,750 | $0 | $0 |
| 2022 | $350 | $17,750 | $3,075 | $14,675 |
| 2021 | $350 | $17,750 | $3,075 | $14,675 |
| 2020 | $350 | $17,750 | $3,075 | $14,675 |
| 2019 | $298 | $13,975 | $3,075 | $10,900 |
| 2018 | $298 | $13,975 | $3,075 | $10,900 |
| 2017 | $298 | $13,975 | $3,075 | $10,900 |
| 2016 | $278 | $13,975 | $3,075 | $10,900 |
| 2015 | $259 | $13,975 | $3,075 | $10,900 |
| 2014 | -- | $13,975 | $3,075 | $10,900 |
| 2013 | -- | $16,425 | $0 | $0 |
Source: Public Records
Map
Nearby Homes
- 3004 Nicole Cir
- 2998 Nicole Cir
- 3646 Falcon Rd
- 2909 Nicole Cir
- 3113 Berna Way
- 559 Cliff St
- 2828 Reeds Chapel Rd
- 517 Cliff St
- 542 Cliff St
- 512 Cliff St
- Lot 2 Morelock Rd
- 4027 White Wood Cir
- 3409 Copper Ridge Rd
- 00 N Davy Crockett Pkwy
- Lot 1 N Davy Crockett Pkwy
- 2993 Nicole Cir
- 1134 Shannons Little Mountain Rd
- Lot 1 E Andrew Johnson Hwy
- 2356 Reese St
- 0 Brights Pike
- 1525 Elgin Dr
- 1523 Elgin Dr
- 1535 Elgin Dr
- 1509 Elgin Dr
- 1545 Elgin Dr
- 3545 Reeds Chapel Rd
- 3505 Reeds Chapel Rd
- 1560 Elgin Dr
- 3431 Reeds Chapel Rd
- 1565 Elgin Dr
- 1486 N Morelock Rd
- 1575 Elgin Dr
- 3532 Reeds Chapel Rd
- 1570 Elgin Dr
- 3355 Reeds Chapel Rd
- 3547 Reeds Chapel Rd
- 1596 Elgin Dr
- 3287 Reeds Chapel Rd
- 3348 Reeds Chapel Rd
- 3265 Reeds Chapel Rd