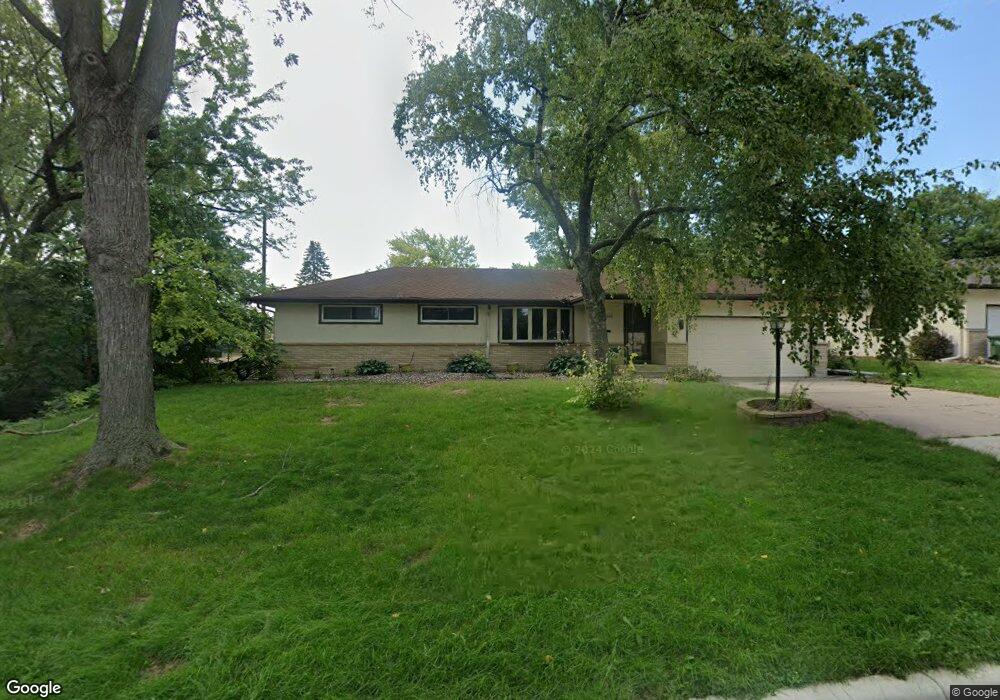
3512 32nd Ave NE Saint Anthony, MN 55418
Estimated Value: $524,000 - $597,000
4
Beds
2
Baths
2,479
Sq Ft
$227/Sq Ft
Est. Value
About This Home
This home is located at 3512 32nd Ave NE, Saint Anthony, MN 55418 and is currently estimated at $561,936, approximately $226 per square foot. 3512 32nd Ave NE is a home located in Hennepin County with nearby schools including Wilshire Park Elementary School, Highland Elementary School, and St. Anthony Middle School.
Ownership History
Date
Name
Owned For
Owner Type
Purchase Details
Closed on
Dec 22, 2023
Sold by
Jones Jeffrey Scott
Bought by
Jeffrey Jones Living Trust and Jones
Current Estimated Value
Purchase Details
Closed on
Jun 10, 2019
Sold by
Bourke Lucas and Ashley Melanie
Bought by
Jones Jeffrey Scott
Home Financials for this Owner
Home Financials are based on the most recent Mortgage that was taken out on this home.
Original Mortgage
$340,000
Interest Rate
3.7%
Mortgage Type
New Conventional
Purchase Details
Closed on
Aug 28, 2017
Sold by
Tholkes Michaek and Tholkes Kari A
Bought by
Bourke Melanie and Bourke Luke
Home Financials for this Owner
Home Financials are based on the most recent Mortgage that was taken out on this home.
Original Mortgage
$370,440
Interest Rate
3.78%
Mortgage Type
New Conventional
Purchase Details
Closed on
Nov 18, 2014
Sold by
Tholkes Michael and Tholkes Kari A
Bought by
Tholkes Kari A and Tholkes Michael
Create a Home Valuation Report for This Property
The Home Valuation Report is an in-depth analysis detailing your home's value as well as a comparison with similar homes in the area
Home Values in the Area
Average Home Value in this Area
Purchase History
| Date | Buyer | Sale Price | Title Company |
|---|---|---|---|
| Jeffrey Jones Living Trust | $500 | None Listed On Document | |
| Jones Jeffrey Scott | $425,000 | Burnet Title | |
| Bourke Melanie | $205,800 | None Available | |
| Bourke Melanie | $205,800 | None Available | |
| Tholkes Kari A | -- | None Available | |
| Tholkes Michael | -- | None Available |
Source: Public Records
Mortgage History
| Date | Status | Borrower | Loan Amount |
|---|---|---|---|
| Previous Owner | Jones Jeffrey Scott | $340,000 | |
| Previous Owner | Bourke Melanie | $370,440 |
Source: Public Records
Tax History Compared to Growth
Tax History
| Year | Tax Paid | Tax Assessment Tax Assessment Total Assessment is a certain percentage of the fair market value that is determined by local assessors to be the total taxable value of land and additions on the property. | Land | Improvement |
|---|---|---|---|---|
| 2024 | $9,904 | $516,400 | $206,000 | $310,400 |
| 2023 | $9,416 | $508,200 | $194,000 | $314,200 |
| 2022 | $8,802 | $503,000 | $200,000 | $303,000 |
| 2021 | $7,088 | $459,000 | $204,000 | $255,000 |
| 2020 | $7,194 | $423,000 | $175,000 | $248,000 |
| 2019 | $6,619 | $408,000 | $160,000 | $248,000 |
| 2018 | $5,020 | $365,000 | $126,000 | $239,000 |
| 2017 | $4,910 | $273,000 | $101,000 | $172,000 |
| 2016 | $4,903 | $273,000 | $98,000 | $175,000 |
| 2015 | $4,375 | $237,000 | $91,000 | $146,000 |
| 2014 | -- | $225,000 | $101,000 | $124,000 |
Source: Public Records
Map
Nearby Homes
- 3232 Old Highway 8
- 3153 Old Highway 8 Unit B103A
- 3153 Old Highway 8 Unit 304A
- 3212 33rd Ave NE
- 2904 Old Highway 8
- 3013 Silver Lake Rd NE
- 2916 31st Ave NE
- 2911 Troseth Rd
- 3212 29th Ave NE
- 3511 Maplewood Dr
- 2164 Eustis St
- 2446 County Road D W
- 2452 County Road D W
- 3637 Coolidge St NE
- 3243 Mckinley St NE
- 737 Mccallum Dr
- 3621 Edward St NE
- 2517 36th Ave NE
- 3808 Foss Rd Unit 2
- 2601 Kenzie Terrace Unit 402
- 3508 32nd Ave NE
- 3108 Croft Dr
- 3112 Croft Dr
- 3108 Croft Dr
- 3104 Croft Dr
- 3509 31st Ave NE
- 3504 32nd Ave NE
- 3504 32nd Ave NE
- 3200 Croft Dr
- 3108 3108 Croft Dr
- 3100 Croft Dr
- 3505 31st Ave NE
- 3500 32nd Ave NE
- 3104 3104 Croft Dr
- 3105 3105 Croft Dr
- 3201 Skycroft Dr
- 3204 Croft Dr
- 3205 3205 Croft-Drive-
- 3201 3201 Skycroft Dr
- 3105 Croft Dr