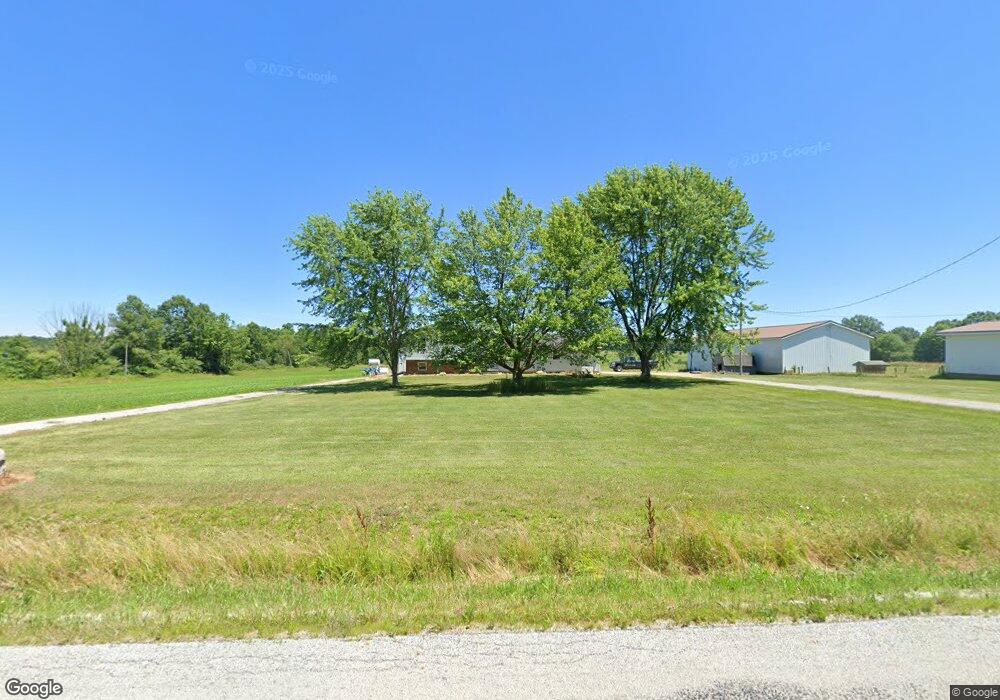
3512 Alliance Rd Rootstown, OH 44272
Estimated Value: $596,000
3
Beds
2
Baths
2,028
Sq Ft
$294/Sq Ft
Est. Value
About This Home
This home is located at 3512 Alliance Rd, Rootstown, OH 44272 and is currently priced at $596,000, approximately $293 per square foot. 3512 Alliance Rd is a home located in Portage County with nearby schools including Southeast High School.
Ownership History
Date
Name
Owned For
Owner Type
Purchase Details
Closed on
Nov 3, 2020
Sold by
Mann Family Trust
Bought by
Mann Craig C
Current Estimated Value
Purchase Details
Closed on
Oct 23, 2020
Sold by
Mann Family Trust
Bought by
Mann Family Trust
Purchase Details
Closed on
Feb 6, 2001
Sold by
Mann Ricky Wayne
Bought by
Mann Craig C and Mann Christine E
Purchase Details
Closed on
Jan 8, 2001
Sold by
Mann Ann Marie
Bought by
Mann Ricky Wayne
Purchase Details
Closed on
Mar 8, 1989
Bought by
Mann Ricky Wayne and Mann Anne
Create a Home Valuation Report for This Property
The Home Valuation Report is an in-depth analysis detailing your home's value as well as a comparison with similar homes in the area
Purchase History
| Date | Buyer | Sale Price | Title Company |
|---|---|---|---|
| Mann Craig C | -- | Gyekenyesi Heather A | |
| Mann Craig C | -- | None Available | |
| Mann Family Trust | -- | Gyeignyfsi Heather A | |
| Mann Family Trust | -- | None Listed On Document | |
| Mann Family Trust | -- | None Listed On Document | |
| Mann Craig C | -- | -- | |
| Mann Ricky Wayne | -- | -- | |
| Mann Ricky Wayne | -- | -- |
Source: Public Records
Tax History
| Year | Tax Paid | Tax Assessment Tax Assessment Total Assessment is a certain percentage of the fair market value that is determined by local assessors to be the total taxable value of land and additions on the property. | Land | Improvement |
|---|---|---|---|---|
| 2025 | $4,438 | $235,380 | $160,200 | $75,180 |
| 2024 | $4,347 | $235,380 | $160,200 | $75,180 |
| 2023 | $2,914 | $172,700 | $113,930 | $58,770 |
| 2022 | $3,043 | $172,700 | $113,930 | $58,770 |
| 2021 | $3,069 | $172,700 | $113,930 | $58,770 |
| 2020 | $2,227 | $60,520 | $14,250 | $46,270 |
| 2019 | $2,232 | $60,520 | $14,250 | $46,270 |
| 2018 | $2,216 | $54,750 | $14,250 | $40,500 |
| 2017 | $2,107 | $54,750 | $14,250 | $40,500 |
| 2016 | $2,099 | $54,750 | $14,250 | $40,500 |
| 2015 | $2,013 | $54,750 | $14,250 | $40,500 |
| 2014 | $2,052 | $54,750 | $14,250 | $40,500 |
| 2013 | $2,031 | $54,750 | $14,250 | $40,500 |
Source: Public Records
Map
Nearby Homes
- 8464 & 8446 Tallmadge Rd
- 8492 & 8476 Tallmadge Rd
- 3545 Porter Rd
- 0 Yale Rd Unit 5190725
- 3207 Prairie Cir
- 3609 State Route 225
- 3798 State Route 183
- 0 Ohio 225 Unit 5174573
- 0 Wayland Rd Unit 5191883
- 2434 Taft Ave
- 4133 State Route 225
- 6747 Giddings Rd
- 2639 Ohio 183
- 0 John Thomas
- 9865 Tallmadge Rd
- 9672 Whippoorwill Rd
- 941 Porter Rd
- 00 Ohio 14
- 4087 Industry
- 1731 Ohio 225
- 3484 Alliance Rd
- 0 Alliance Rd Unit 1029937
- 0 Alliance Rd Unit 4506376
- 3476 Alliance Rd
- 3462 Alliance Rd
- 3450 Alliance Rd
- 3467 Alliance Rd
- 3434 Alliance Rd
- 8298 Henderson Rd
- 3451 Alliance Rd
- 3634 Alliance Rd
- 3433 Alliance Rd
- 3417 Alliance Rd
- 8089 Giddings Rd
- 8059 Giddings Rd
- 8080 Giddings Rd
- 7951 Giddings Rd
- 3717 Alliance Rd
- 8314 Henderson Rd
- 7989 Giddings Rd
Your Personal Tour Guide
Ask me questions while you tour the home.