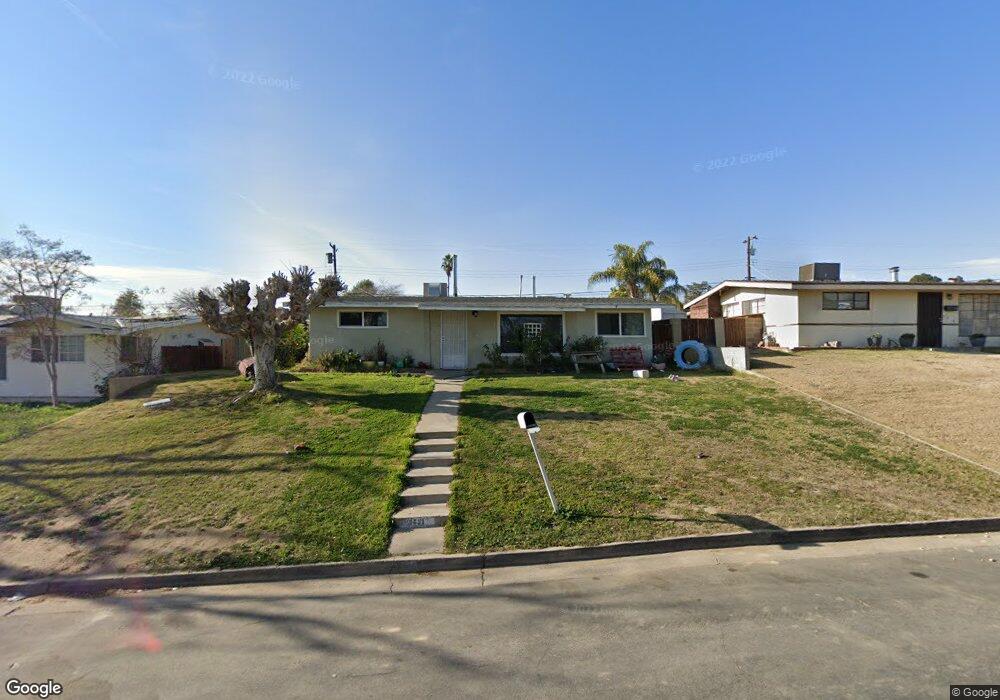
3512 Bucknell St Bakersfield, CA 93305
College Heights NeighborhoodEstimated Value: $292,000 - $327,000
3
Beds
2
Baths
1,444
Sq Ft
$210/Sq Ft
Est. Value
About This Home
This home is located at 3512 Bucknell St, Bakersfield, CA 93305 and is currently estimated at $303,693, approximately $210 per square foot. 3512 Bucknell St is a home located in Kern County with nearby schools including Myra A. Noble Elementary School, Washington Middle School, and East Bakersfield High School.
Ownership History
Date
Name
Owned For
Owner Type
Purchase Details
Closed on
Aug 30, 2019
Sold by
Gonzales & Company Llc
Bought by
Spraque Michael S and Spraque Nicole E
Current Estimated Value
Purchase Details
Closed on
Jul 19, 2019
Sold by
Comeau Bill and Comeau Leslie
Bought by
Gonzales & Company Llc
Purchase Details
Closed on
Jan 28, 2008
Sold by
Seney Ronald R and Seney Donna M
Bought by
Comeau Bill and Comeau Leslie
Home Financials for this Owner
Home Financials are based on the most recent Mortgage that was taken out on this home.
Original Mortgage
$135,000
Interest Rate
6.09%
Mortgage Type
Seller Take Back
Purchase Details
Closed on
Sep 27, 2004
Sold by
Seney Ronald R and Seney Donna M
Bought by
Seney Ronald R and Seney Donna M
Purchase Details
Closed on
Dec 16, 1994
Sold by
Seney Ronald R and Seney Donna M
Bought by
Seney Ronald R and Seney Donna M
Home Financials for this Owner
Home Financials are based on the most recent Mortgage that was taken out on this home.
Original Mortgage
$55,683
Interest Rate
9.2%
Mortgage Type
FHA
Create a Home Valuation Report for This Property
The Home Valuation Report is an in-depth analysis detailing your home's value as well as a comparison with similar homes in the area
Home Values in the Area
Average Home Value in this Area
Purchase History
| Date | Buyer | Sale Price | Title Company |
|---|---|---|---|
| Spraque Michael S | $165,000 | Ticor Title Company | |
| Gonzales & Company Llc | $131,000 | Ticor Title Company | |
| Comeau Bill | $135,000 | Fidelity National Title | |
| Seney Ronald R | -- | -- | |
| Seney Ronald R | -- | Stewart Title |
Source: Public Records
Mortgage History
| Date | Status | Borrower | Loan Amount |
|---|---|---|---|
| Previous Owner | Comeau Bill | $135,000 | |
| Previous Owner | Seney Ronald R | $55,683 |
Source: Public Records
Tax History
| Year | Tax Paid | Tax Assessment Tax Assessment Total Assessment is a certain percentage of the fair market value that is determined by local assessors to be the total taxable value of land and additions on the property. | Land | Improvement |
|---|---|---|---|---|
| 2025 | $2,789 | $180,446 | $43,743 | $136,703 |
| 2024 | $2,729 | $176,909 | $42,886 | $134,023 |
| 2023 | $2,729 | $173,442 | $42,046 | $131,396 |
| 2022 | $2,665 | $170,042 | $41,222 | $128,820 |
| 2021 | $2,554 | $166,709 | $40,414 | $126,295 |
| 2020 | $2,517 | $165,000 | $40,000 | $125,000 |
| 2019 | $2,325 | $150,000 | $38,000 | $112,000 |
| 2018 | $2,224 | $143,000 | $36,000 | $107,000 |
| 2017 | $2,197 | $139,000 | $35,000 | $104,000 |
| 2016 | $1,860 | $122,000 | $31,000 | $91,000 |
| 2015 | $1,857 | $121,000 | $30,000 | $91,000 |
| 2014 | $1,802 | $119,000 | $30,000 | $89,000 |
Source: Public Records
Map
Nearby Homes
- 925 Radcliffe Ave
- 3213 Bucknell St
- 909 Oberlin Ct
- 917 Stanford Ct
- 3117 Haley St
- 3012 Fordham St
- 700 Hillcrest Dr
- 3013 Cornell St
- 1801 University Ave
- 2927 Skyline Blvd
- 2904 Cornell St
- 2804 Haley St
- 1207 Columbus St
- 2713 Haley St
- 2709 Haley St
- 616 Magnolia Ave
- 2800 Pomona St
- 2616 N King St
- 1217 Crawford St
- 2880 N Inyo St
- 3508 Bucknell St
- 3516 Bucknell St
- 3520 Bucknell St
- 3504 Bucknell St
- 3513 Bryn Mawr Dr
- 3517 Bryn Mawr Dr
- 3509 Bryn Mawr Dr
- 3509 Bucknell St
- 3524 Bucknell St
- 3517 Bucknell St
- 3500 Bucknell St
- 3505 Bryn Mawr Dr
- 3521 Bryn Mawr Dr
- 3505 Bucknell St
- 3523 Bucknell St
- 3501 Bryn Mawr Dr
- 3600 Bucknell St
- 3525 Bryn Mawr Dr
- 3501 Bucknell St
- 1201 Telegraph Ave
Your Personal Tour Guide
Ask me questions while you tour the home.