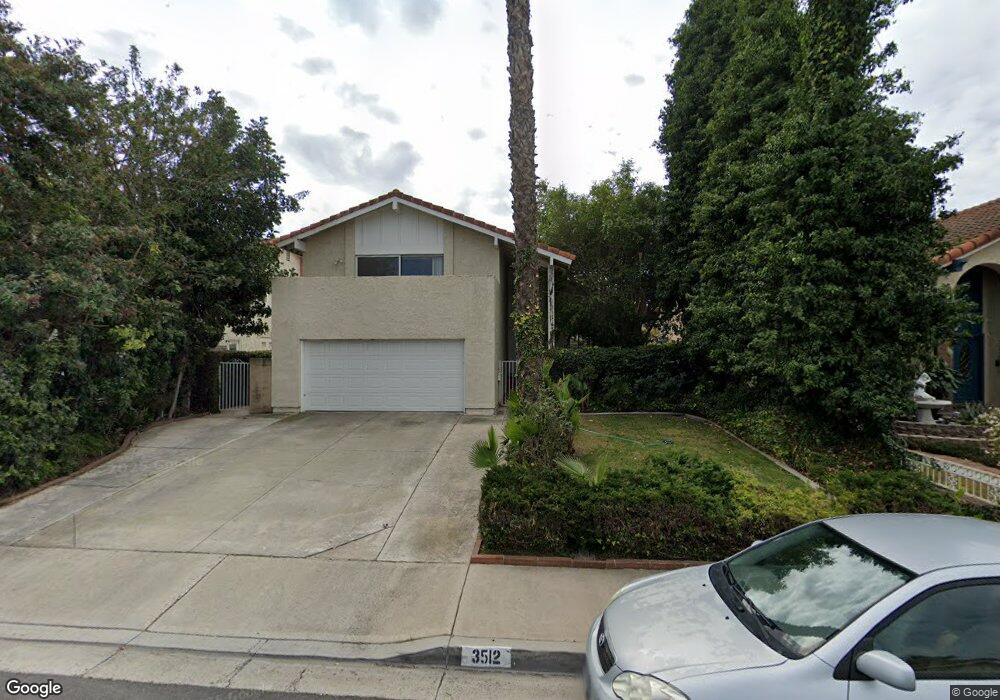
3512 Pecan St Irvine, CA 92606
Walnut NeighborhoodEstimated Value: $1,591,000 - $1,754,000
4
Beds
3
Baths
2,277
Sq Ft
$733/Sq Ft
Est. Value
About This Home
This home is located at 3512 Pecan St, Irvine, CA 92606 and is currently estimated at $1,669,713, approximately $733 per square foot. 3512 Pecan St is a home located in Orange County with nearby schools including College Park Elementary School, Venado Middle School, and Irvine High School.
Ownership History
Date
Name
Owned For
Owner Type
Purchase Details
Closed on
May 24, 2023
Sold by
Brown Dina Shafir and Brown Steven M
Bought by
2023 Dina S Brown And Steven M Brown Revocabl
Current Estimated Value
Purchase Details
Closed on
Jul 30, 1997
Sold by
Hayes Chuck and Hayes Terina
Bought by
Brown Steven M and Brown Dina Shafir
Home Financials for this Owner
Home Financials are based on the most recent Mortgage that was taken out on this home.
Original Mortgage
$214,600
Interest Rate
7.43%
Purchase Details
Closed on
Dec 18, 1995
Sold by
Yu Steven Chi Chen and Yu Edith Mei Hua
Bought by
Hayes Chuck and Hayes Terina
Home Financials for this Owner
Home Financials are based on the most recent Mortgage that was taken out on this home.
Original Mortgage
$242,250
Interest Rate
7.5%
Create a Home Valuation Report for This Property
The Home Valuation Report is an in-depth analysis detailing your home's value as well as a comparison with similar homes in the area
Home Values in the Area
Average Home Value in this Area
Purchase History
| Date | Buyer | Sale Price | Title Company |
|---|---|---|---|
| 2023 Dina S Brown And Steven M Brown Revocabl | -- | None Listed On Document | |
| Brown Steven M | $270,000 | Commonwealth Land Title | |
| Hayes Chuck | $255,000 | Commonwealth Land Title |
Source: Public Records
Mortgage History
| Date | Status | Borrower | Loan Amount |
|---|---|---|---|
| Previous Owner | Brown Steven M | $214,600 | |
| Previous Owner | Hayes Chuck | $242,250 |
Source: Public Records
Tax History
| Year | Tax Paid | Tax Assessment Tax Assessment Total Assessment is a certain percentage of the fair market value that is determined by local assessors to be the total taxable value of land and additions on the property. | Land | Improvement |
|---|---|---|---|---|
| 2025 | $4,523 | $431,115 | $233,941 | $197,174 |
| 2024 | $4,523 | $422,662 | $229,354 | $193,308 |
| 2023 | $4,405 | $414,375 | $224,857 | $189,518 |
| 2022 | $4,316 | $406,250 | $220,448 | $185,802 |
| 2021 | $4,214 | $398,285 | $216,126 | $182,159 |
| 2020 | $4,190 | $394,202 | $213,910 | $180,292 |
| 2019 | $4,096 | $386,473 | $209,716 | $176,757 |
| 2018 | $4,021 | $378,896 | $205,604 | $173,292 |
| 2017 | $3,937 | $371,467 | $201,572 | $169,895 |
| 2016 | $3,764 | $364,184 | $197,620 | $166,564 |
| 2015 | $3,708 | $358,714 | $194,651 | $164,063 |
| 2014 | $3,636 | $351,688 | $190,838 | $160,850 |
Source: Public Records
Map
Nearby Homes
- 14541 Savin Ave
- 3761 Provincetown Ave
- 17 Rhode Island
- 3852 Uris Ct
- 14272 Saarinen Ct
- 14072 Picasso Ct
- 14172 Moore Ct
- 175 Zephyr Run Unit 175
- 280 Tustin Field Dr
- 424 Deerfield Ave Unit 172
- 4161 Old Mill St
- 328 Flyers Ln
- 24 Millstone Unit 137
- 390 Deerfield Ave Unit 125
- 374 Aviator Ln
- 1 Emperor
- 369 Deerfield Ave Unit 35
- 4062 Escudero Dr
- 11 Pienza
- 4511 Charleville Cir
Your Personal Tour Guide
Ask me questions while you tour the home.