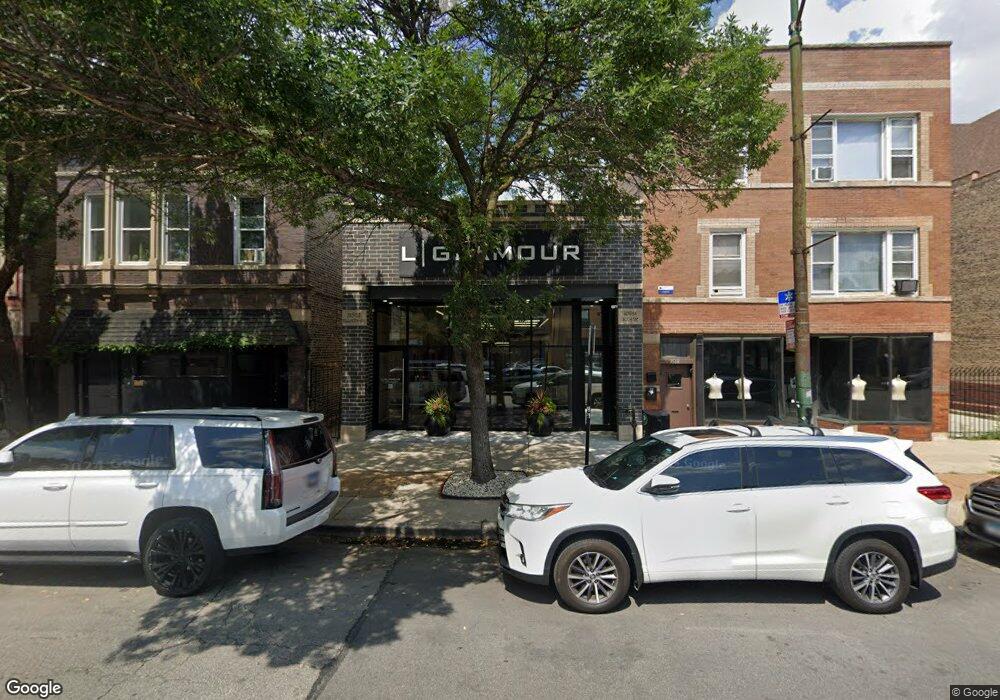
3512 W Fullerton Ave Chicago, IL 60647
Logan Square NeighborhoodEstimated Value: $299,087
--
Bed
--
Bath
2,400
Sq Ft
$125/Sq Ft
Est. Value
About This Home
This home is located at 3512 W Fullerton Ave, Chicago, IL 60647 and is currently estimated at $299,087, approximately $124 per square foot. 3512 W Fullerton Ave is a home located in Cook County with nearby schools including Monroe Elementary School, Kelvyn Park High School, and Good Shepherd Christian Academy.
Ownership History
Date
Name
Owned For
Owner Type
Purchase Details
Closed on
Sep 16, 2021
Sold by
Fuller35prop Inc
Bought by
Gonzalez Antonio
Current Estimated Value
Purchase Details
Closed on
Jun 10, 2015
Sold by
Latin American Chamber Of Commerce Of Il
Bought by
Fuller35prop Inc
Purchase Details
Closed on
Mar 28, 2012
Sold by
Forecom Challenger Inc
Bought by
Latin American Chamber Of Commerce Illin
Purchase Details
Closed on
Aug 22, 2011
Sold by
Ruiz Gonzalo
Bought by
Forecom Challenger Inc
Purchase Details
Closed on
Jun 21, 1999
Sold by
Bolano Jaime O and Torres Garza Juan A
Bought by
Latin American Chamber Of Commerce
Home Financials for this Owner
Home Financials are based on the most recent Mortgage that was taken out on this home.
Original Mortgage
$112,350
Interest Rate
8.25%
Mortgage Type
Commercial
Create a Home Valuation Report for This Property
The Home Valuation Report is an in-depth analysis detailing your home's value as well as a comparison with similar homes in the area
Home Values in the Area
Average Home Value in this Area
Purchase History
| Date | Buyer | Sale Price | Title Company |
|---|---|---|---|
| Gonzalez Antonio | $245,000 | Chicago Title Insurance Co | |
| Fuller35prop Inc | $120,000 | Stewart Title | |
| Latin American Chamber Of Commerce Illin | -- | Cti | |
| Forecom Challenger Inc | -- | None Available | |
| Latin American Chamber Of Commerce | $136,000 | -- |
Source: Public Records
Mortgage History
| Date | Status | Borrower | Loan Amount |
|---|---|---|---|
| Previous Owner | Latin American Chamber Of Commerce | $112,350 | |
| Closed | Latin American Chamber Of Commerce | $40,000 |
Source: Public Records
Tax History Compared to Growth
Tax History
| Year | Tax Paid | Tax Assessment Tax Assessment Total Assessment is a certain percentage of the fair market value that is determined by local assessors to be the total taxable value of land and additions on the property. | Land | Improvement |
|---|---|---|---|---|
| 2024 | $16,899 | $67,273 | $28,438 | $38,835 |
| 2023 | $12,641 | $79,808 | $14,625 | $65,183 |
| 2022 | $12,641 | $61,250 | $14,625 | $46,625 |
| 2021 | $13,194 | $65,397 | $14,625 | $50,772 |
| 2020 | $8,105 | $36,250 | $14,625 | $21,625 |
| 2019 | $15,107 | $74,918 | $14,625 | $60,293 |
| 2018 | $5,100 | $25,817 | $14,625 | $11,192 |
| 2017 | $6,027 | $27,999 | $12,796 | $15,203 |
| 2016 | $5,608 | $27,999 | $12,796 | $15,203 |
| 2015 | $5,131 | $27,999 | $12,796 | $15,203 |
| 2014 | $9,455 | $50,960 | $12,796 | $38,164 |
| 2013 | -- | $50,960 | $12,796 | $38,164 |
Source: Public Records
Map
Nearby Homes
- 2342 N Kimball Ave
- 3547 W Belden Ave
- 2435 N Monticello Ave
- 2323 N Monticello Ave
- 2512 N Kimball Ave
- 2305 N Kimball Ave Unit G
- 3430 W Lyndale St
- 2343 N Lawndale Ave
- 2506 N Monticello Ave
- 3566 W Palmer St
- 3707 W Altgeld St Unit 1
- 3434 W Palmer St
- 1617 N Sawyer Ave
- 2421 N Sawyer Ave Unit 1
- 2337 N Sawyer Ave
- 2501 N Sawyer Ave
- 3659 W Palmer St
- 2628 N Spaulding Ave Unit 1
- 2121 N Saint Louis Ave Unit 3S
- 3731 W Lyndale St
- 3514 W Fullerton Ave
- 3508 W Fullerton Ave
- 3508 W Fullerton Ave Unit 3
- 3508 W Fullerton Ave Unit 2
- 3508 W Fullerton Ave
- 3516 W Fullerton Ave
- 3518 W Fullerton Ave
- 3500 W Fullerton Ave Unit 2
- 3520 W Fullerton Ave
- 2415 N Drake Ave
- 2414 N Saint Louis Ave
- 2414 N Saint Louis Ave Unit 3A
- 2418 N Saint Louis Ave
- 2420 N Saint Louis Ave
- 3524 W Fullerton Ave
- 3524 W Fullerton Ave Unit 1
- 2419 N Drake Ave
- 2421 N Drake Ave Unit 1
- 2421 N Drake Ave
- 2349 N Drake Ave Unit 2349-3