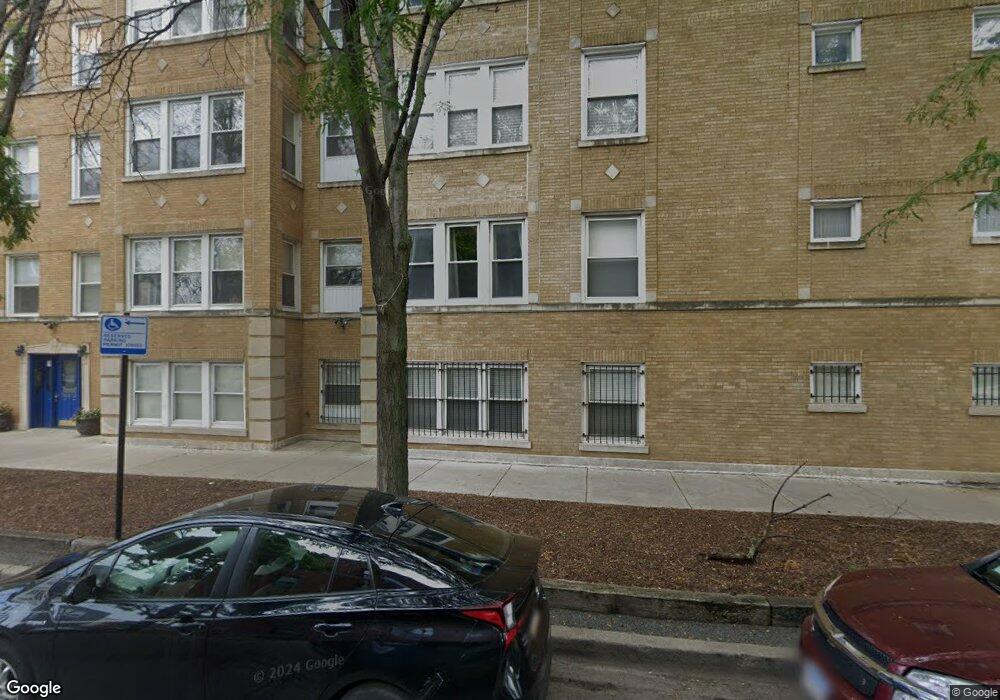
3512 W Leland Ave Unit 35123 Chicago, IL 60625
Albany Park NeighborhoodEstimated Value: $199,829 - $260,000
1
Bed
1
Bath
1,000
Sq Ft
$231/Sq Ft
Est. Value
About This Home
This home is located at 3512 W Leland Ave Unit 35123, Chicago, IL 60625 and is currently estimated at $231,457, approximately $231 per square foot. 3512 W Leland Ave Unit 35123 is a home located in Cook County with nearby schools including Haugan Elementary School, Roosevelt High School, and ASPIRA Haugan Middle School.
Ownership History
Date
Name
Owned For
Owner Type
Purchase Details
Closed on
Jul 31, 2024
Sold by
Arroyave Sonia
Bought by
Zigo3512
Current Estimated Value
Purchase Details
Closed on
Mar 31, 2000
Sold by
Albany Bank & Trust Company Na
Bought by
Arroyave Sonia
Home Financials for this Owner
Home Financials are based on the most recent Mortgage that was taken out on this home.
Original Mortgage
$99,750
Interest Rate
8.31%
Create a Home Valuation Report for This Property
The Home Valuation Report is an in-depth analysis detailing your home's value as well as a comparison with similar homes in the area
Home Values in the Area
Average Home Value in this Area
Purchase History
| Date | Buyer | Sale Price | Title Company |
|---|---|---|---|
| Zigo3512 | -- | None Listed On Document | |
| Arroyave Sonia | $105,000 | -- |
Source: Public Records
Mortgage History
| Date | Status | Borrower | Loan Amount |
|---|---|---|---|
| Previous Owner | Arroyave Sonia | $99,750 |
Source: Public Records
Tax History Compared to Growth
Tax History
| Year | Tax Paid | Tax Assessment Tax Assessment Total Assessment is a certain percentage of the fair market value that is determined by local assessors to be the total taxable value of land and additions on the property. | Land | Improvement |
|---|---|---|---|---|
| 2024 | $1,897 | $14,208 | $1,433 | $12,775 |
| 2023 | $1,828 | $12,277 | $1,147 | $11,130 |
| 2022 | $1,828 | $12,277 | $1,147 | $11,130 |
| 2021 | $1,805 | $12,276 | $1,146 | $11,130 |
| 2020 | $1,627 | $10,380 | $593 | $9,787 |
| 2019 | $1,654 | $11,633 | $593 | $11,040 |
| 2018 | $1,625 | $11,633 | $593 | $11,040 |
| 2017 | $942 | $7,737 | $532 | $7,205 |
| 2016 | $1,053 | $7,737 | $532 | $7,205 |
| 2015 | $1,305 | $9,722 | $532 | $9,190 |
| 2014 | $1,594 | $11,126 | $491 | $10,635 |
| 2013 | $1,551 | $11,126 | $491 | $10,635 |
Source: Public Records
Map
Nearby Homes
- 4734 N Drake Ave
- 4621 N Monticello Ave
- 4534 N Saint Louis Ave
- 4619 N Lawndale Ave Unit 1
- 4714 N Spaulding Ave
- 4906 N Drake Ave Unit 3
- 3711 W Lawrence Ave
- 3618 W Ainslie St Unit 3W
- 4903 N Monticello Ave Unit 3
- 4426 N Drake Ave
- 4900 N Lawndale Ave Unit G
- 4948 N Kimball Ave Unit 4W
- 3550 W Montrose Ave Unit 107
- 3210 W Lawrence Ave
- 4837 N Sawyer Ave
- 4438 N Spaulding Ave
- 4515 N Hamlin Ave
- 4944 N Spaulding Ave Unit 4944
- 5007 N Lawndale Ave
- 3135 W Leland Ave Unit 3W
- 3512 W Leland Ave Unit 35121
- 3512 W Leland Ave Unit 35122
- 3512 W Leland Ave Unit 1E
- 3512 W Leland Ave Unit 2
- 3512 W Leland Ave Unit 3
- 3512 W Leland Ave Unit 1
- 3510 W Leland Ave Unit 35103
- 3510 W Leland Ave Unit 35102
- 3510 W Leland Ave Unit 35101
- 4702 N Saint Louis Ave Unit 470
- 4700 N Saint Louis Ave Unit 470
- 3510 W Leland Ave Unit 47023
- 3510 W Leland Ave Unit 47021
- 3510 W Leland Ave Unit 47003
- 3510 W Leland Ave Unit 47002
- 3510 W Leland Ave Unit 47001
- 4700 N Saint Louis Ave Unit B
- 4700 N Saint Louis Ave Unit 3
- 4702 N Saint Louis Ave Unit 1
- 4700 N Saint Louis Ave Unit 2