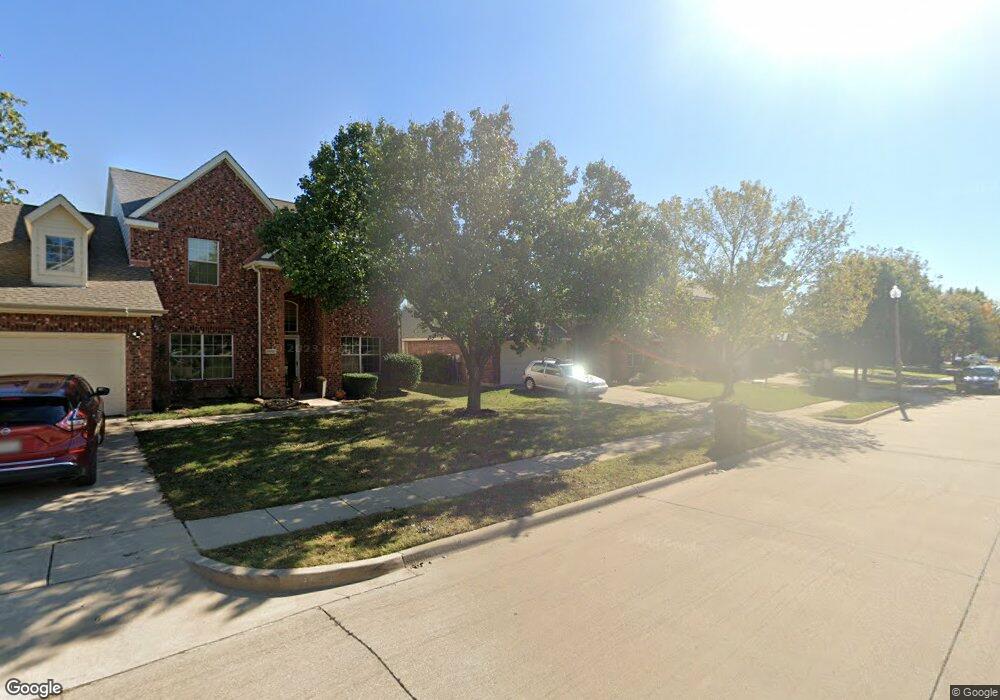
3513 Ranchman Blvd Denton, TX 76210
South Denton NeighborhoodEstimated Value: $352,714 - $378,000
3
Beds
2
Baths
1,706
Sq Ft
$216/Sq Ft
Est. Value
About This Home
This home is located at 3513 Ranchman Blvd, Denton, TX 76210 and is currently estimated at $367,679, approximately $215 per square foot. 3513 Ranchman Blvd is a home located in Denton County with nearby schools including Houston Elementary School, McMath Middle School, and Denton High School.
Ownership History
Date
Name
Owned For
Owner Type
Purchase Details
Closed on
Apr 15, 2013
Sold by
Pfaffly Brandon S and Pfaffly Samantha R
Bought by
Flores Jacob Lee and Flores Alissa Lauren
Current Estimated Value
Home Financials for this Owner
Home Financials are based on the most recent Mortgage that was taken out on this home.
Original Mortgage
$140,030
Outstanding Balance
$99,199
Interest Rate
3.55%
Mortgage Type
New Conventional
Estimated Equity
$268,480
Purchase Details
Closed on
May 31, 2006
Sold by
Jones Lottie and Lassiter Jeff
Bought by
Pfaffly Brandon S and Pfaffly Samantha R
Home Financials for this Owner
Home Financials are based on the most recent Mortgage that was taken out on this home.
Original Mortgage
$28,150
Interest Rate
6.58%
Mortgage Type
Stand Alone Second
Purchase Details
Closed on
Aug 20, 2003
Sold by
Bowen Builders Group Of Texas Inc
Bought by
Jones Lottie and Lassiter Jeff
Home Financials for this Owner
Home Financials are based on the most recent Mortgage that was taken out on this home.
Original Mortgage
$130,683
Interest Rate
6.08%
Mortgage Type
FHA
Create a Home Valuation Report for This Property
The Home Valuation Report is an in-depth analysis detailing your home's value as well as a comparison with similar homes in the area
Home Values in the Area
Average Home Value in this Area
Purchase History
| Date | Buyer | Sale Price | Title Company |
|---|---|---|---|
| Flores Jacob Lee | -- | None Available | |
| Pfaffly Brandon S | -- | Hft | |
| Jones Lottie | -- | -- |
Source: Public Records
Mortgage History
| Date | Status | Borrower | Loan Amount |
|---|---|---|---|
| Open | Flores Jacob Lee | $140,030 | |
| Previous Owner | Pfaffly Brandon S | $28,150 | |
| Previous Owner | Pfaffly Brandon S | $112,600 | |
| Previous Owner | Jones Lottie | $130,683 |
Source: Public Records
Tax History Compared to Growth
Tax History
| Year | Tax Paid | Tax Assessment Tax Assessment Total Assessment is a certain percentage of the fair market value that is determined by local assessors to be the total taxable value of land and additions on the property. | Land | Improvement |
|---|---|---|---|---|
| 2025 | $5,019 | $347,000 | $85,250 | $261,750 |
| 2024 | $6,215 | $321,978 | $0 | $0 |
| 2023 | $4,392 | $292,707 | $85,250 | $256,198 |
| 2022 | $5,649 | $266,097 | $85,250 | $234,128 |
| 2021 | $5,378 | $241,906 | $63,163 | $178,743 |
| 2020 | $5,052 | $221,003 | $63,163 | $157,840 |
| 2019 | $5,161 | $216,318 | $63,163 | $153,155 |
| 2018 | $5,074 | $210,049 | $63,163 | $150,478 |
| 2017 | $4,720 | $190,954 | $37,575 | $153,379 |
| 2016 | $4,406 | $178,240 | $37,575 | $142,280 |
| 2015 | $3,616 | $162,036 | $37,575 | $124,461 |
| 2013 | -- | $142,254 | $37,575 | $104,679 |
Source: Public Records
Map
Nearby Homes
- 2601 Pinto Dr
- 2617 Hereford Rd
- 2617 Hollow Ridge Dr
- 2721 Arabian Ave
- 2713 Clubhouse Dr
- 2508 Pioneer Dr
- 2600 Pioneer Dr
- 3432 Sundown Blvd
- 2505 Pioneer Dr
- 2804 Hollow Ridge Dr
- 2713 Hilcroft Ave
- 2817 Hereford Rd
- 2616 Hilcroft Ave
- 2617 Bissonet Dr
- 2409 Loon Lake Rd
- 3428 Tuscan Hills Cir
- 3448 Tuscan Hills Cir
- 2209 Loon Lake Rd
- 2913 Montebello Dr
- 2917 Montebello Dr
- 3509 Ranchman Blvd
- 3601 Ranchman Blvd
- 3605 Ranchman Blvd
- 3505 Ranchman Blvd
- 3516 Big Horn Trail
- 3600 Big Horn Trail
- 3512 Big Horn Trail
- 3604 Big Horn Trail
- 3533 Mustang Dr
- 3536 Mustang Dr
- 3508 Big Horn Trail
- 3609 Ranchman Blvd
- 3501 Ranchman Blvd
- 3608 Big Horn Trail
- 3532 Mustang Dr
- 3504 Big Horn Trail
- 3525 Mustang Dr
- 3613 Ranchman Blvd
- 3612 Big Horn Trail
- 2601 Arabian Ave