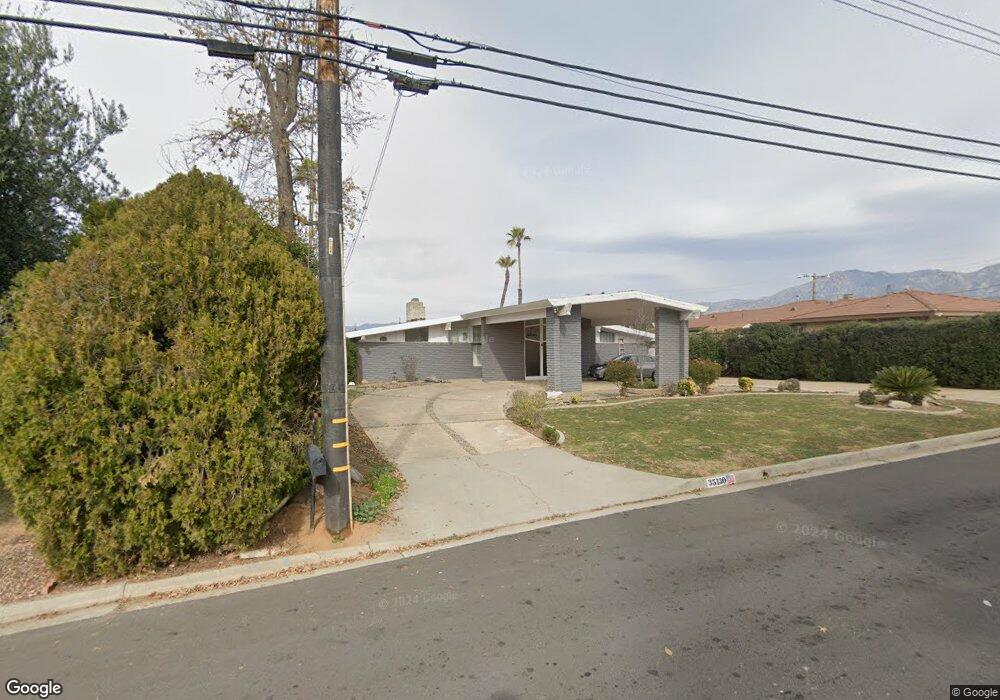
35130 Buena Mesa Dr Calimesa, CA 92320
Estimated Value: $572,000 - $602,000
2
Beds
3
Baths
2,306
Sq Ft
$256/Sq Ft
Est. Value
About This Home
This home is located at 35130 Buena Mesa Dr, Calimesa, CA 92320 and is currently estimated at $590,611, approximately $256 per square foot. 35130 Buena Mesa Dr is a home located in Riverside County with nearby schools including Summerwind Trails, Beaumont Senior High School, and Competitive Edge Charter Academy (CECA).
Ownership History
Date
Name
Owned For
Owner Type
Purchase Details
Closed on
Mar 11, 2009
Sold by
Avila Erika
Bought by
Avila Rafael
Current Estimated Value
Home Financials for this Owner
Home Financials are based on the most recent Mortgage that was taken out on this home.
Original Mortgage
$201,286
Outstanding Balance
$128,126
Interest Rate
5.15%
Mortgage Type
FHA
Estimated Equity
$462,485
Purchase Details
Closed on
Jul 3, 2008
Sold by
Wolff Liza R
Bought by
Federal National Mortgage Association
Purchase Details
Closed on
May 24, 2000
Sold by
Zoumbos Judith S
Bought by
Wolff Liza R
Home Financials for this Owner
Home Financials are based on the most recent Mortgage that was taken out on this home.
Original Mortgage
$163,651
Interest Rate
8.55%
Mortgage Type
FHA
Create a Home Valuation Report for This Property
The Home Valuation Report is an in-depth analysis detailing your home's value as well as a comparison with similar homes in the area
Home Values in the Area
Average Home Value in this Area
Purchase History
| Date | Buyer | Sale Price | Title Company |
|---|---|---|---|
| Avila Rafael | -- | Commonwealth Land Title Co | |
| Avila Rafael | $205,000 | Commonwealth Land Title Co | |
| Federal National Mortgage Association | $167,675 | Landsafe Title | |
| Wolff Liza R | $152,500 | Old Republic Title Company |
Source: Public Records
Mortgage History
| Date | Status | Borrower | Loan Amount |
|---|---|---|---|
| Open | Avila Rafael | $201,286 | |
| Previous Owner | Wolff Liza R | $163,651 |
Source: Public Records
Tax History Compared to Growth
Tax History
| Year | Tax Paid | Tax Assessment Tax Assessment Total Assessment is a certain percentage of the fair market value that is determined by local assessors to be the total taxable value of land and additions on the property. | Land | Improvement |
|---|---|---|---|---|
| 2025 | $3,263 | $263,967 | $64,376 | $199,591 |
| 2023 | $3,263 | $253,719 | $61,877 | $191,842 |
| 2022 | $3,174 | $248,745 | $60,664 | $188,081 |
| 2021 | $3,113 | $243,869 | $59,475 | $184,394 |
| 2020 | $3,073 | $241,370 | $58,866 | $182,504 |
| 2019 | $3,019 | $236,638 | $57,712 | $178,926 |
| 2018 | $2,972 | $231,999 | $56,581 | $175,418 |
| 2017 | $2,919 | $227,451 | $55,472 | $171,979 |
| 2016 | $3,186 | $222,992 | $54,385 | $168,607 |
| 2015 | $2,815 | $219,644 | $53,569 | $166,075 |
| 2014 | $2,753 | $215,344 | $52,521 | $162,823 |
Source: Public Records
Map
Nearby Homes
- 35104 Mesa Grande Dr
- 832 Hilltop Ct
- 293 Country Club Dr
- 35080 Chandler Ave Unit 11
- 35080 Chandler Ave
- 35080 Chandler Ave Unit 77
- 0 Slack Place
- 244 Country Club Dr
- 372 Sandalwood Dr
- 384 Sandalwood Dr
- 1278 2nd Place
- 199 Summit View Dr Unit B
- 199 Summit View Dr Unit E
- 406 Myrtlewood Dr
- 9425 Sharondale Rd
- 1334 Pinehurst Dr
- 9401 Sharondale Rd
- 10320 217 Calimesa
- 1286 Pinehurst Dr
- 9583 Crestknoll Dr
- 35120 Buena Mesa Dr
- 35140 Buena Mesa Dr
- 35135 Buena Mesa Dr
- 35111 Buena Mesa Dr
- 35110 Buena Mesa Dr
- 35150 Buena Mesa Dr
- 35091 Buena Mesa Dr
- 35148 Buena Mesa Dr
- 35170 Buena Mesa Dr
- 35167 Buena Mesa Dr
- 35144 Buena Mesa Dr
- 35080 Buena Mesa Dr
- 35073 Buena Mesa Dr
- 35190 Buena Mesa Dr
- 35050 Buena Mesa Dr
- 35061 Buena Mesa Dr
- 35211 Buena Mesa Dr
- 0 Buena Mesa Dr Unit I10036436
- 0 Buena Mesa Dr Unit E12080884
- 0 Buena Mesa Dr Unit E12098556