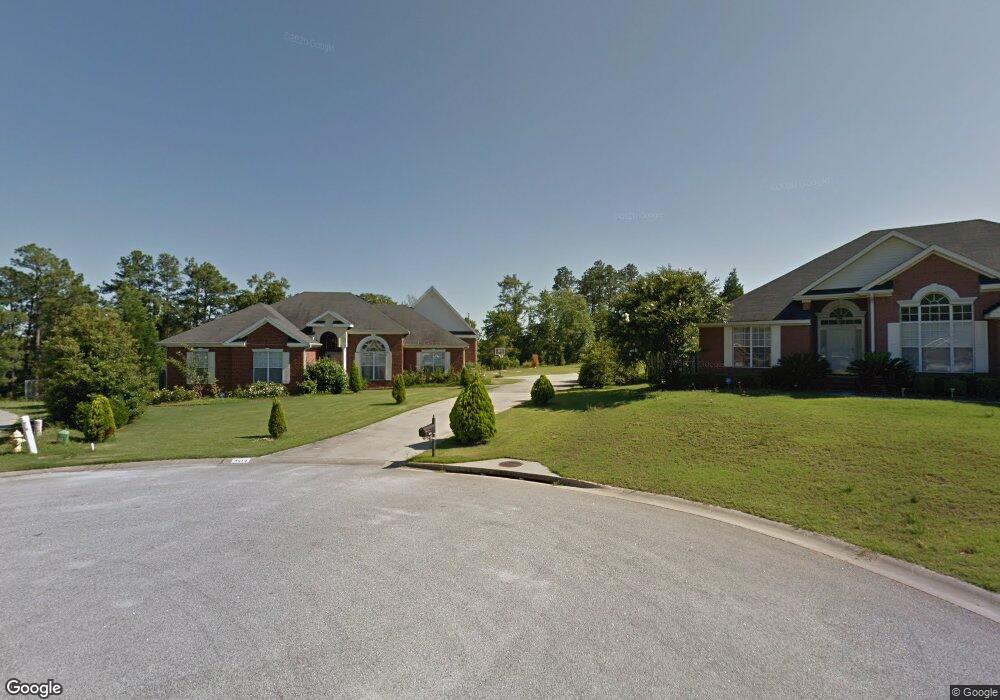
3514 Camak Dr Augusta, GA 30909
Belair NeighborhoodEstimated Value: $340,000 - $446,298
4
Beds
4
Baths
3,808
Sq Ft
$99/Sq Ft
Est. Value
About This Home
This home is located at 3514 Camak Dr, Augusta, GA 30909 and is currently estimated at $375,825, approximately $98 per square foot. 3514 Camak Dr is a home located in Richmond County with nearby schools including Sue Reynolds Elementary School, Langford Middle School, and Johnson Magnet.
Ownership History
Date
Name
Owned For
Owner Type
Purchase Details
Closed on
Aug 23, 2023
Sold by
Leal Constante M
Bought by
Leal Constante M and Leal Rose Mary
Current Estimated Value
Purchase Details
Closed on
Sep 4, 2002
Sold by
Keystone Homes Inc
Bought by
Leal Constante M and Leal Rose Mary
Home Financials for this Owner
Home Financials are based on the most recent Mortgage that was taken out on this home.
Original Mortgage
$192,455
Interest Rate
6.31%
Mortgage Type
VA
Purchase Details
Closed on
Feb 8, 2002
Sold by
Home Sites Ltd
Bought by
Keystone Homes Inc
Home Financials for this Owner
Home Financials are based on the most recent Mortgage that was taken out on this home.
Original Mortgage
$134,100
Interest Rate
7.02%
Mortgage Type
Construction
Create a Home Valuation Report for This Property
The Home Valuation Report is an in-depth analysis detailing your home's value as well as a comparison with similar homes in the area
Home Values in the Area
Average Home Value in this Area
Purchase History
| Date | Buyer | Sale Price | Title Company |
|---|---|---|---|
| Leal Constante M | -- | -- | |
| Leal Constante M | $186,900 | -- | |
| Keystone Homes Inc | $18,900 | -- |
Source: Public Records
Mortgage History
| Date | Status | Borrower | Loan Amount |
|---|---|---|---|
| Previous Owner | Leal Constante M | $192,455 | |
| Previous Owner | Keystone Homes Inc | $134,100 |
Source: Public Records
Tax History Compared to Growth
Tax History
| Year | Tax Paid | Tax Assessment Tax Assessment Total Assessment is a certain percentage of the fair market value that is determined by local assessors to be the total taxable value of land and additions on the property. | Land | Improvement |
|---|---|---|---|---|
| 2024 | -- | $162,160 | $15,600 | $146,560 |
| 2023 | $858 | $145,980 | $15,600 | $130,380 |
| 2022 | $1,806 | $152,130 | $15,600 | $136,530 |
| 2021 | $910 | $117,647 | $15,600 | $102,047 |
| 2020 | $1,218 | $117,647 | $15,600 | $102,047 |
| 2019 | $1,025 | $105,107 | $14,800 | $90,307 |
| 2018 | $1,082 | $102,126 | $14,800 | $87,326 |
| 2017 | $1,152 | $102,126 | $14,800 | $87,326 |
| 2016 | $1,268 | $102,126 | $14,800 | $87,326 |
| 2015 | $1,383 | $102,126 | $14,800 | $87,326 |
| 2014 | $1,480 | $102,126 | $14,800 | $87,326 |
Source: Public Records
Map
Nearby Homes
- 3465 Camak Dr
- 3655 Crawfordville Dr
- 3605 Wrightsboro Rd
- 3650 Crawfordville Dr
- 3246 Lexington Way
- 3009 Norwood Ct
- 5226 Aruba Cir
- 2928 Aylesbury Dr
- 5149 Wheeler Lake Rd
- 3314 Camak Dr
- 3312 Camak Dr
- 3736 Wrightsboro Rd
- 5129 Wheeler Lake Rd
- 1133 Brookstone Way
- 1125 Brookstone Way
- 1215 Brookstone Way
- 3106 Clarendon Ct
- 1701 Forest Creek Rd
- 1404 Feldspar Ct
- 4086 Harper Franklin Ave
- 3510 Camak Dr
- 2920 Eidson Dr
- 3513 Camak Dr
- 3904 Barnett Crossing
- 2924 Eidson Dr
- 3506 Camak Dr
- 3511 Camak Dr
- 3985 Madison Ln
- 3502 Camak Dr
- 3906 Barnett Crossing
- 2917 Eidson Dr
- 3509 Camak Dr
- 3987 Madison Ln
- 2926 Eidson Dr
- 3507 Camak Dr
- 2912 Eidson Dr
- 3982 Madison Ln
- 3989 Madison Ln
- 3981 Madison Ln
- 0 Barnett Crossing